
ISM PMI Part One
I have wanted to write about the PMI’s for a while now, but in the public eye (the blog) I kept putting off because the piece would be either one or two thousand words, or a book, and I didn’t love either idea. Then I started writing this “simple indicators” series and figured that I could just do a multi-part series on the PMI’s. In this intro we will look at why they are important data points, will look at two charts, and then will go over what some seem to get very wrong about the data.
Not The Business Cycle Holy Grail
No really, it is not. The number one thing that people seem to get wrong about the PMI is that it can be a leading AND a coincidental indicator. That means that sometimes it leads, but other times it just moves in lockstep. So while you can kind of call the economy in real-time, you often can not call markets in the same way. Remember that most of the time markets are a discounting mechanism and more often than not they already sniffed out the upturn or downturn. So while the PMI is very important, it is not like you have a perennial three month edge over things. This game is not that easy.
And Yet Sometimes It Is
Yeah I wrote that. Despite the PMI not being the actual business cycle or some massive perennial leading indicator, it is a very useful tool and does call the medium to long term cyclical up and down turns.
The PMI-Purchasing Managers Index is a survey sent out to purchasing managers each month. It asks things like do you plan on buying more or less this month, are prices higher or lower, etc. Each part is turned into a data series (big fans and users of the priced paid component) and they build a diffusion index. In the case of the ISM PMI-and there are more PMI’s now-the middle, or zero line, is actually 50. Readings above 50=expansionary, and below 50=contractionary. But the index moves above and below the 50 line, and can stay above or below for months and months and even a few years.
One thing that is important to note however is that just because it is below 50 does not mean we are in a recession and just because it is above 50 does not mean we are in a healthy economy. Like everything it depends on context.
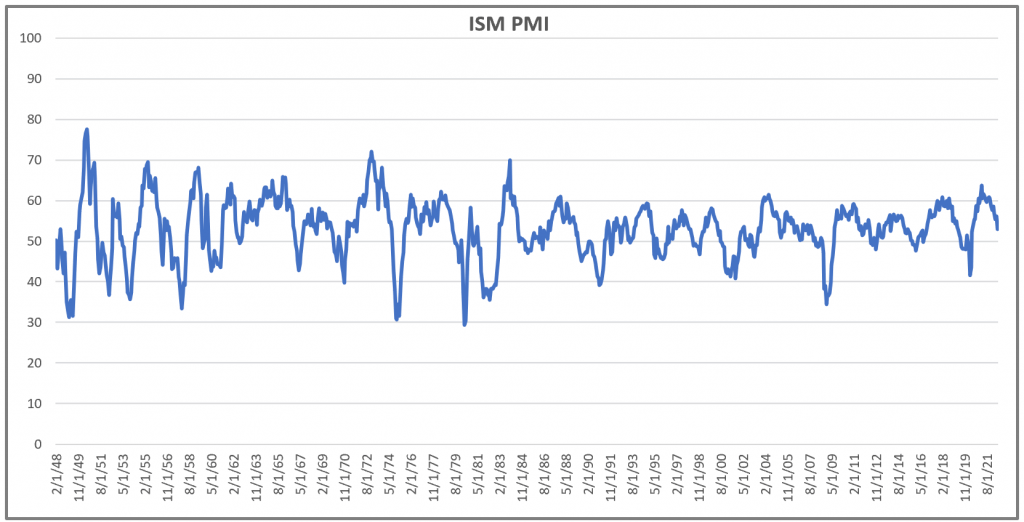
Another thing about the PMI is that with data back to 1948 we have found, and by we I mean everyone that looks at it, that overtime it tracks realized GDP very closely. But it is not subject to massive revisions and we get the data monthly instead of quarterly. So it is both more timely, and more useful. Here is the chart back to 1948.
PMI And Markets
It is chart time. In future installments we will go deeper into the economics of the PMI, as well as other PMIs and ways to use all of this but let’s look at how the PMI is useful for looking at both the stock market as well as bond yields.
In the first chart we have the PMI and the SP500 year over year. You might notice a few things. First is that they are very correlated. Next is that sometimes they diverge. Finally you might notice that the PMI does not always lead the SP500. This is an important point as some prognosticators would make you think the PMI is an actual holy grail….and it is not.

One more thing worth nothing here is that it shows the SP500 year over year. So where it is on the chart at any given point already happened. This is obvious but thinking this way helps you avoid the mental habit of projecting something into the future even though it already happened. Leading is one thing but coincidental is a very different thing.
In any manner the PMI and the SP500 have a very real relationship. The PMI marks the business cycle up and downturns, but so does the SP500. As with a lot of this stuff the money to be made is to find when there is a divergence and figuring out if the market is wrong or not. The other side however is that the PMI can do a LOT to help you shift your asset allocation. While the chart is of the SP500 some sectors and assets do better and worse in different PMI regimes. But more on that in the future, a lot more.
You don’t see this chart as often, but I didn’t make it up on my own. but the PMI also moves along with the changes in the 10-yr yield. When growth is increasing, and presumably investors expect higher inflation along with it, bonds sell off and yields go higher. The opposite is mostly true as well as yields tend to go lower when the economy is softening as investors buy bonds for safety.

This relationship is not as tight as it is with the SP500, but we still find it useful. Like we repeat probably too often indicators indicate things. So if yields are moving one way and the PMI is moving a different way, then we want to try and figure out why they are diverging. Usually the reason has something to do with inflation dynamics, but it is always a place to go looking for answers. After all our primary economic framework is the Growth/Inflation Matrix, so things like growth matter a lot to us and how we see the world.
In summary the PMI is a great data point. It tells us a lot about where we are in the current cyclical upturn or downturn. It also have a high correlation with the year over year change in the SP500 and in the movement of bond yields. Despite this, the PMI is not the business cycle and it is not always a leading indicator. We will go a lot deeper in future installments, but figured it would be better to start now vs wait for another forever months away to write a book.
This is the fifth in a new series of pieces we will be doing on relatively simple indicators and models that should be part of any macro traders dashboard. Nothing is the holy grail, but there are several useful tools that indicate different conditions. The PMI is such a staple on any macro dashboard that we decided to add this in with this series. In the future we will break off the PMI into its own series of sorts.
Happy Trading and Be Safe,
P.S. If you liked this then take a free two week trial of our service. If you have any questions send me an email or find me over at Twitter @DavidTaggart