
A Different Way To Do Oscillators
If you use charts, and clearly we do, you have seen all the oscillators. RSI, Stochastics (which have no stochastics), ROC, CCI, MACD, Williams %R, etc. There are a bunch. And while there are a million ways to use any tool, the classic way to use these tools is as overbought/oversold indicators. Of course what those terms means is subject to interpretation.
In our work we primarily use them in two ways.
First, and probably the most common for us, is to look for momentum divergences. We use the canned RSI indicator and look for times where price and momentum are not moving in line with each other. So price hits a new high, but momentum hits a lower high. Momentum divergences appear at almost every single important top or bottom. Of course the other side of that is that not every momentum divergence does not lead to a top or a bottom. So we look for them in areas we expect a change in trend due to other reasons (we will write some legit tutorials on this in the future).
Second is to determine if a market is too extended to buy or short, or if we should be closing out positions due to things being overextended. We believe in momentum, and buy breakouts and short breakdowns, so this type of thing matters to us.
But here is the deal, we don’t love the regular oscillators for this. They only look at price. Different variations of price vs price X periods back. They don’t look at breadth, volatility, etc. Just price. So what have we done to fix some of this? We build our own tools when it makes sense, and in this case it makes tons of sense. We are not the first to do this, in fact all of these ideas have been written about by others, but here are two of our own homegrown indicators. One is a direct attempt at duplicating a well known indicator, and the other is our own idea, based on other ideas we have read.
Volatility Adjusted Oscillator
This oscillator uses the SP500 and the VIX. You can build it for other indices with volatility indices as well. We take a 30-Day simple moving average, the deviation of the current price from that moving average, and then divide it by the VIX. So we have a simple price based oscillator combined with a volatility measure. This enables the oscillator to adjust for periods of high and low vol. In high vol regimes we usually have very sharp rallies and declines, and in low vol regimes we get mostly a lot of consistent but grinding action. In our view this was a worthwhile pursuit and we have found it to be useful in our risk management and trade entry/exit. By the way, in the chart below it says 1.0, but this is like v37k or something. That just didn’t sound cool, whereas SuperMegaOsc did.
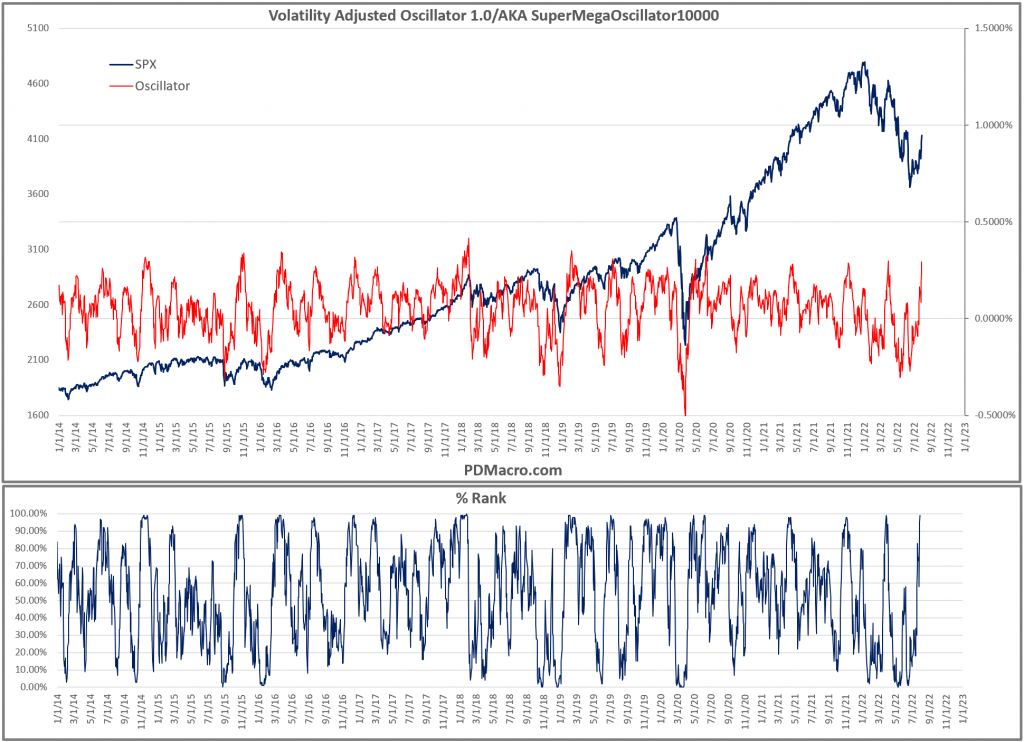
The next thing we did was build a percent rank oscillator. All this does is rank the readings of SuperMegaOsc. So a 99% reading is very overbought and a 1% reading is very oversold. As you can guess we do not buy or sell at those levels. And in traditional oscillator fashion we mainly pay attention when it is 80%+ and below 20%. But love the 95% and 5% areas. Some very good risk/reward moves at the true extremes.
S&P Inspired S&P500 Oscillator
Not an original name, and not an original idea, and yet it is one we thought was worth trying to build. Even if our output is slightly different, the mechanics of it made sense and we find it useful. This indicator uses the deviation from the 20-day moving average and the 10-Day Advance Decline Oscillator. So it combines price with breadth. This is important because if Apple gaps up 5%, MSFT, AMZN, and Google stay flat, and everything else is down you could have an overbought reading despite not being very overbought. Ridiculous example but you get the idea.
The indicator is inspired by an oscillator that S&P sells for supposedly a few thousand bucks a year. If you have ever heard Jim Cramer say “the oscillator” this is what he is talking about (you took the tv off mute?). But I have seen pics and this one is really close to what they have. Regardless I like the idea of breadth and price.

As you can see this one can vary a LOT. This is because sometimes you get both extended price AND breadth. When that happens to the upside or downside you get very extended moves. Interestingly enough when you get a big upside thrust we tend to see positive returns in the ensuing 3-12 months. The reverse is not true however. This is but one way to measure and look for breadth thrusts.
We mostly use this indicator to find potential buy and sell points. The divergences are fairly messy so we don’t focus on them much here. But if our overall outlook is bullish/bearish and the market gets extended vs our view we will look to this to potentially take the other side of the trade.
In both cases-the vol adjusted oscillator and the price+breadth oscillator we also look at the nothing readings. If nothing is extended, and we find a good trade opportunity then we will take it. We attempt to manage market, sector, and company risk, and each one is different. If the market is not at an extreme then for the entry or exit we don’t have to worry about the market in the same way. Put another way, if we have a great situation we want to get long with great fundamentals, sentiment, and it fits our macro view, with a good chart, but the entire market is stretched to a true extreme, then we will either wait on the trade OR take a far small initial position. Market risk oscillates between 30-90% of the risk in a position so we try and listen to it.
This is the fifth in a new series of pieces we will be doing on relatively simple indicators and models that should be part of any macro traders dashboard. Nothing is the holy grail, but there are several useful tools that indicate different conditions, and oscillators that take a broader approach can be good ones. They can help you better measure risk and make better data driven decisions.
Happy Trading and Be Safe,
P.S. If you liked this then take a free two week trial of our service. If you have any questions send me an email or find me over at Twitter @DavidTaggart