
The Basic Materials and Utilities Ratio: Just Call It The Real Time PMI
Basic Materials/Utilities XLB/XLU…The Real Time PMI?
So the Basic Materials/Utilities ratio is calculated by simply dividing one by the other. If you have the SP Sector data then you can use that or just use the sector ETF’s of XLB/XLU. In Excel it would be =XLB/XLU, in Stockcharts.com it would be XLB:XLU, etc. It is simple to do this ratio on almost any charting platform.
Where did it come from?
Honestly I can’t remember. I doubt I invented it, probably saw a chart someone posted, idk. But upon further research I have found it to be a really useful tool. Maybe this is the breakout moment for the ratio. Share this post with friends and find out lol.
So what is it and why is it useful?
It turns out that in the same way the Copper/Gold ratio measures inflation in real time the XLB/XLU ratio measures growth in real time as well. If we accept that the PMI is basically a monthly GDP number in terms of trend and inflection points, then you will see that the XLB/XLU ratio ends up doing for growth what the Copper/Gold ratio does for inflation.
Why would XLB/XLU contain useful information about growth and inflection points in the growth cycle? Well we first have to accept or believe that markets are a pretty good discounting mechanism. If you mostly believe this then we can proceed, otherwise this is all gibberish. We then have to accept that no one buys utilities because of their growth prospects. All evidence points to them being extremely rate sensitive and mostly a safe haven sector with above average dividends.
With markets being a discounting mechanism then it would make sense that the wisdom of crowds would have fund managers buying the sector when they think the economy is turning up, and selling the sector when they think the economy is turning lower. But the trend of basic materials by itself does not isolate this very well. But if we take the ratio of basic materials and utilities we can see when the elusive “smart money” or “they” are being more or less aggressive buying/selling basic materials and utilities. If basic materials are outpacing utilities then we can surmise that funds expect a cyclical upturn, and if utilities are leading then they expect a downturn.
So with that explanation out of the way let’s look at a chart. This chart shows how the XLB/XLU ratio tends to lead the ISM PMI higher and lower. It is not perfect, but it is pretty good.

If you are new to this ratio stuff and the ISM PMI then it is worthwhile to look at the ISM PMI and its super power. In this next chart we have the PMI overlaid with the SP500 year over year percentage change.

Once again a very good, but not perfect indicator. One thing worth noting, one very important thing, is that most of the time this is a coincidental relationship. sometimes the divergences are large enough to make it worth looking at a trade, but usually they move mostly in lockstep.
This, or maybe it is THIS, is why the XLB/XLU-Basic materials/utilities ratio is so useful. It is kind of like a real time indicator of the growth cycle. if it is turning up, growth is probably turning up, it is turning down then growth is probably turning down. And if neither are actually the case then at least the expectations are turning higher or lower, and that drives asset prices.
A Few Notable Divergences
So if you are still with me, and you now at least accept that the XLB/XLU could be useful, let’s look at a chart of the basic materials/utilities ratio overlaid with the SP500. In the chart below you can see the last 3.5-ish years. One thing you might notice is that you can’t just trade the SP500 based on the ratio, it does have false signals, but if you use it an indicator that does…well it indicates stuff, then you will notice some other things. XLB/XLU turned lower starting in November 2019, and really started to accelerate in early 2020, almost like it kept seeing China’s slowdown due to COVID and thought it might be important. At the 2020 bottom the ratio turned higher a few days before the SP500 bottom. The two peaks in the ratio in June and November 2021 showed a big divergence versus the SP500 as well with the second peak failing to hit a new high. That November peak was also two months before the SP500 finally turned lower.
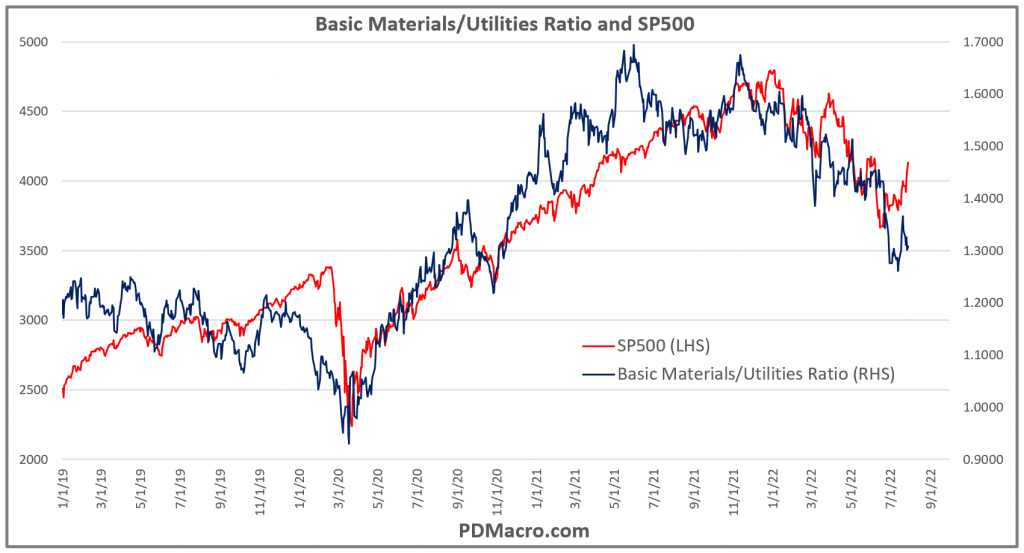
So am I saying the basic materials/utilities ratio is a holy grail? After all it did move before the SP500 at all these important turning points. No, it did do that but it had plenty of false moves as well. If you traded each time there was a slight divergence then you might do ok, but you would probably get chopped up. But combined with other tools, both price based and economic, sentiment, etc., the XLB/XLU ratio can be used to find the early signs up important turning points. A very underrated indicator that should be on every investors macro dashboard.
More fun with the basic materials/utilities ratio.
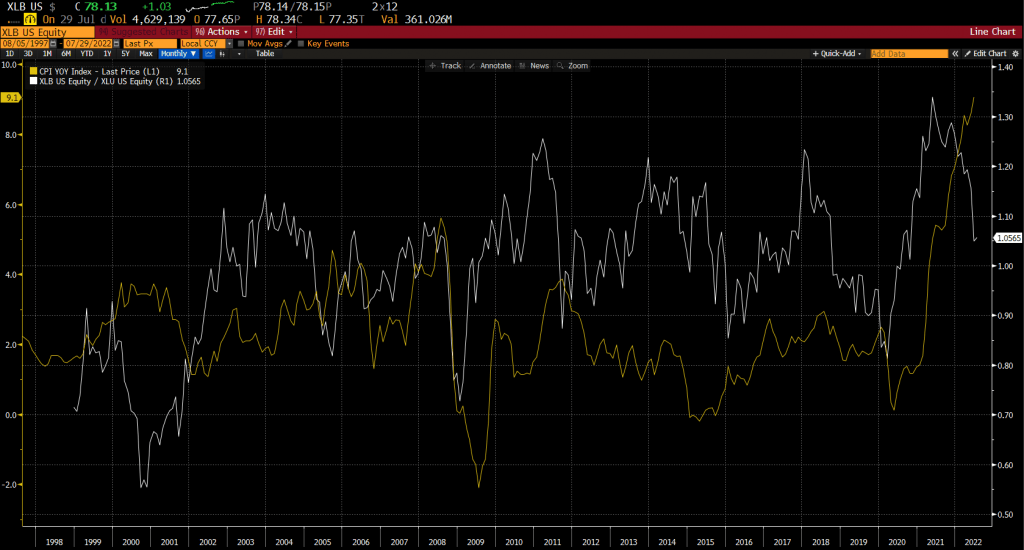
So the XLB/XLU ratio does a great job calling turning points in the growth expectations cycle, but how does it do with inflation? Would it be a surprise if it did pretty well? After all growth and inflation are inexorably linked.
If we look at the next chart we can see that there is a relationship, and it is decent. But compared to the copper/gold ratio, or several other tools, the XLB/XLU ratio is not the first place I would go to inflation expectations, and yet if it is ripping in one direction, and inflation is headed the other direction, it would make me revisit how I view the world and try and figure out what is going on. As you can probably tell we are currently in one of those periods.
For a shop that is a big user of the Growth/Inflation matrix and believes in its usefulness in determining what mix of assets to be overweight/underweight and long/short, it is obvious that tools like the basic materials/utilities ratio combined with the copper/gold ratio can provide some very useful signal both for trade selection and for risk management. We don’t use either in isolation, in fact we don’t use the two in isolation. But we do pay heed to price based signals, because flows drive prices, and investors drive flows, etc.
This is the second in a new series of pieces we will be doing on relatively simple indicators and models that should be part of any macro traders dashboard. Nothing is the holy grail, but there are several useful tools that indicate different conditions, and the basic materials/utilities ratio is both as simple as it gets, and about as useful as well.