Buybacks And Their Effects On Stock Prices
To say buybacks have been in the news the last few months would be a major understatement.

Buybacks have been controversial for a while now, and since the virus bailouts they have become downright toxic. Despite the fact that buybacks are basically, like dividends, just another way to return capital to shareholders, they seem to garner a lot of hate. “Those evil companies buying back their shares when they could be……….with them instead.” I left the answer blank because there doesn’t seem to be a consistent theme with the haters. But you could insert “building a factory” despite most of the biggest buyback companies being the type that don’t have factories, or maybe insert “paying out dividends” despite the fact that the company would still not have the cash anymore and that the distribution is tax inefficient, or maybe you want to insert “just giving all the money to the government” because the government does such a great job of capital allocation and distributing money. Anyways insert whatever you want in the blank space, buybacks are getting a lot of hate in the year of the Rona, but this piece is not focused on defending them so much as how is the buyback factor doing and how might is do going forward…..but for the record I think buybacks are fine and don’t understand the hate when other companies are borrowing money in order to pay dividends which compounds their poor financial conditions… but enough.
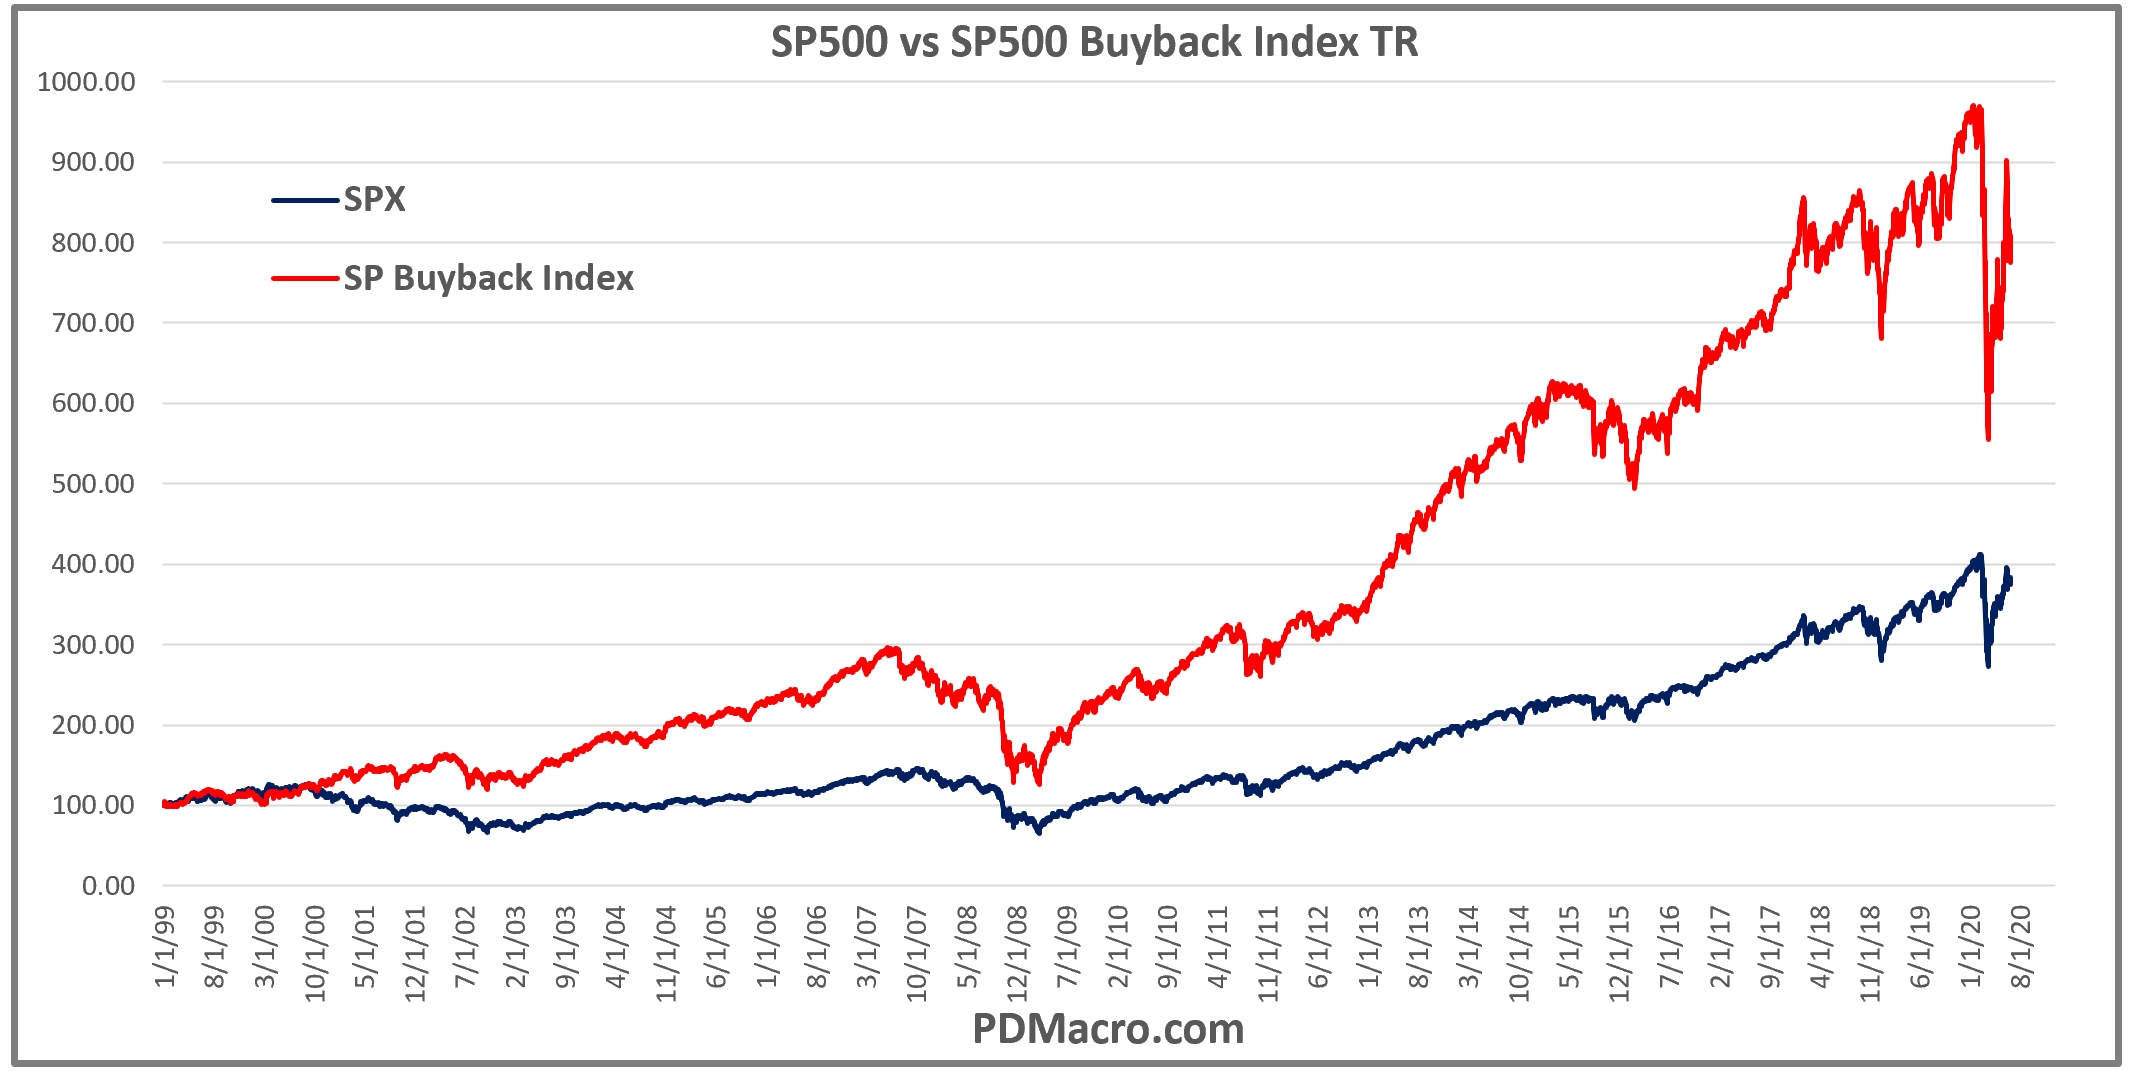
Over the past 20 years owning stocks with the largest buyback programs outperformed the SP500 by a lot. From 1999 until now you would have made 278% buying the SP500, and you would have made 688% owning the SP500 Buyback index, so Buybacks gave you just over double the return. In the chart below you can see how the buyback index trounced the regular SP500 during both cycles of the last 20 years.

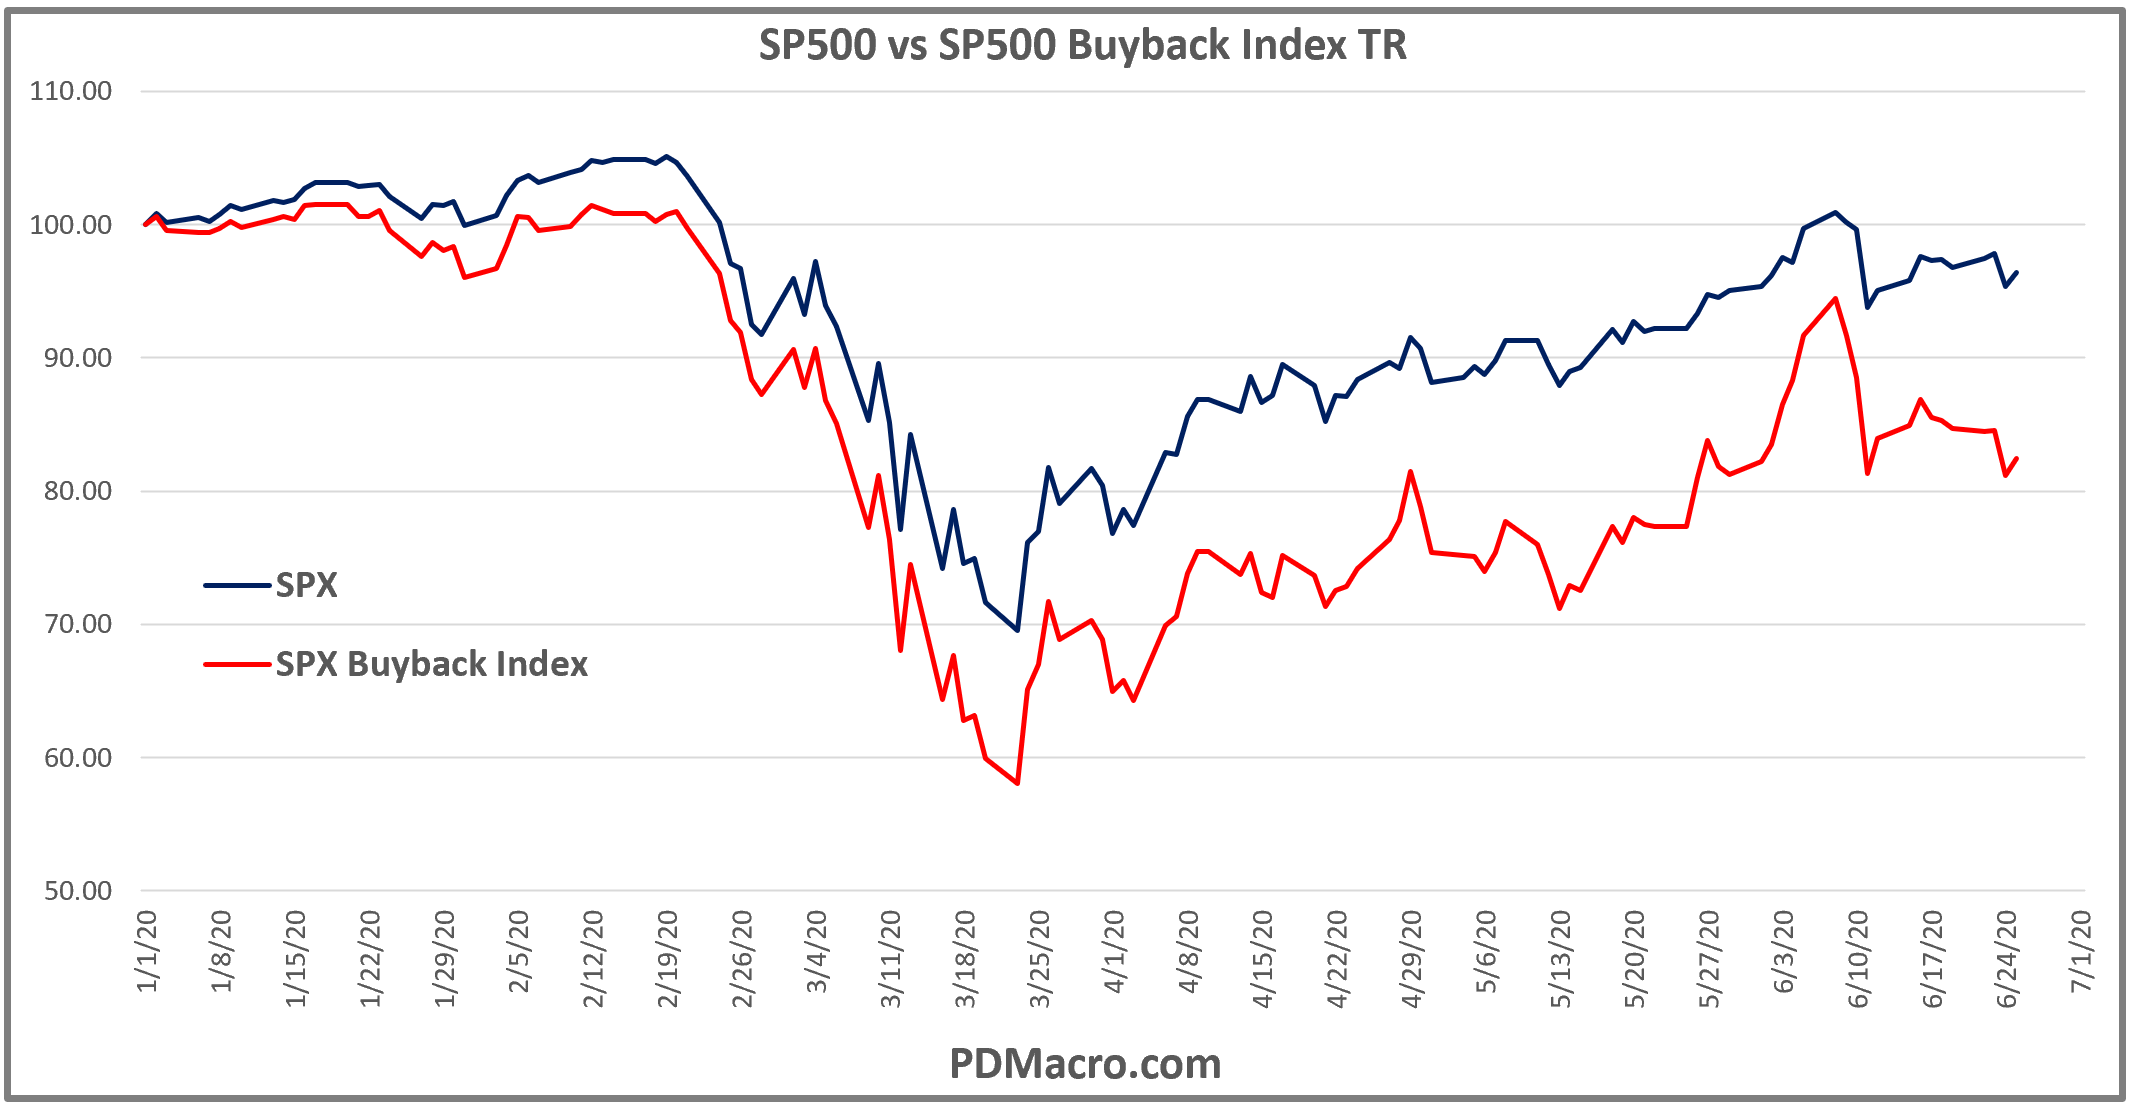
But of course the last chart is from the past. Now that so many people are anti-buyback how is the factor performing? Well since the start of year you can see in the next chart that the correlation is high but a spread in performance has appeared.

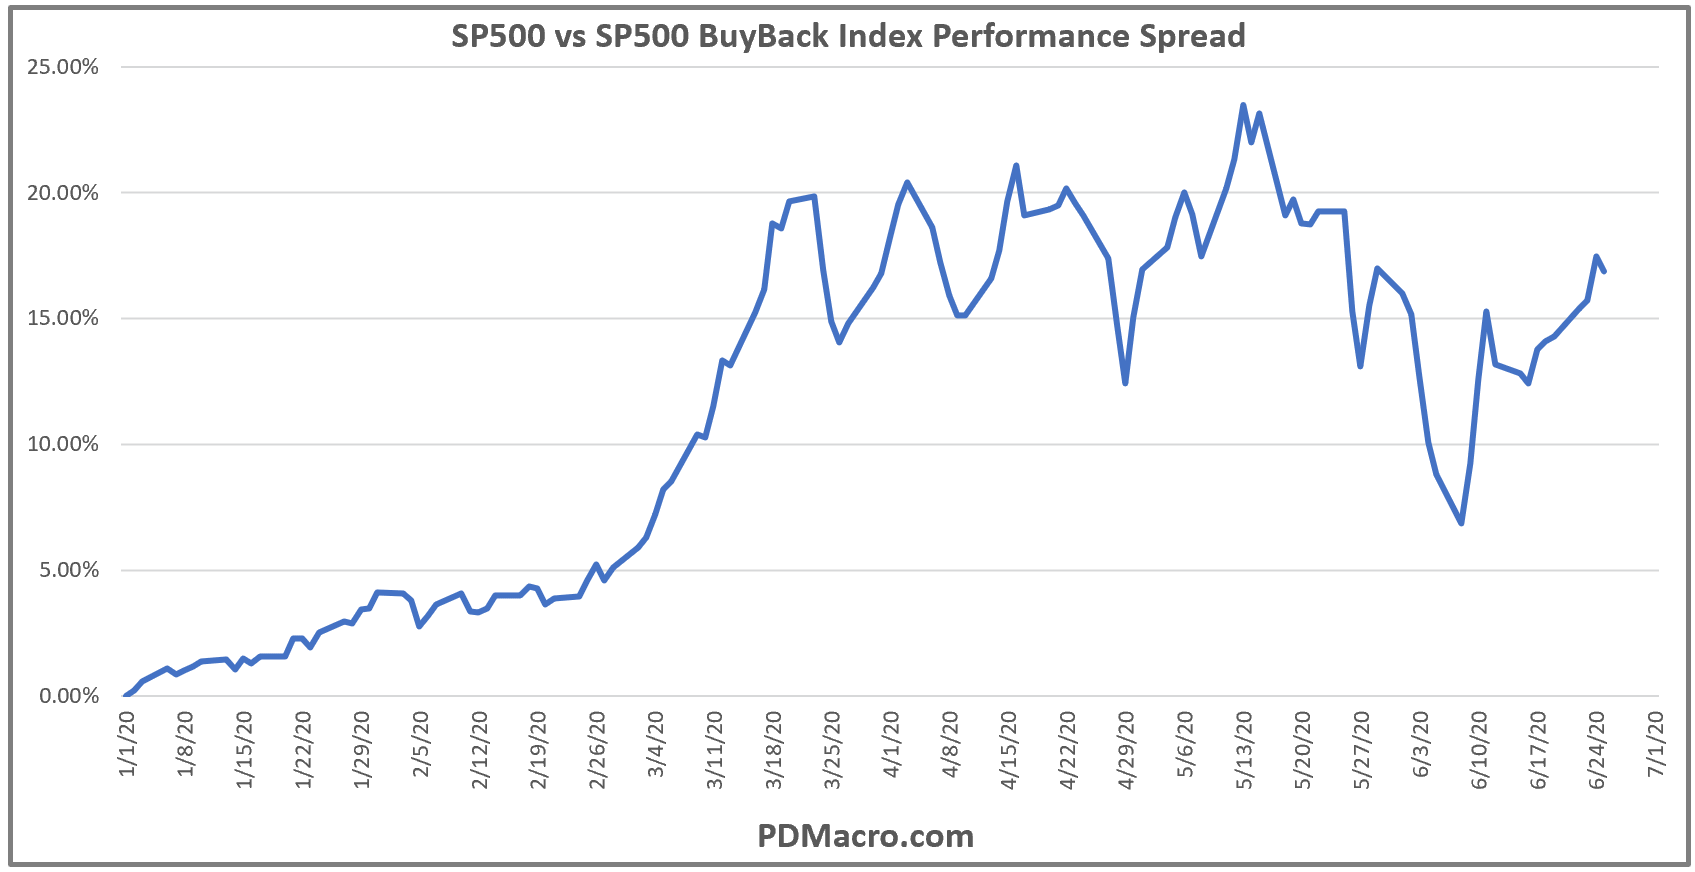
So far the drops are more extreme in the buyback index, while the recoveries are weaker. But to look at the extent of the current underpeformance we charted out the spread between the two. As you can see in the chart below there was a slight spread coming into the Rona Recession but that it absolutely exploded once the shutdowns happened and the hate started to boil over. Since then there has been some volatility in the spread but for the most part it has remained relatively high.

It is far too early to tell what will happen here from the legislation front. Maybe buybacks get banned, maybe they get penalized, maybe they just keep going on like they have been for 40 years. Just yesterday the Fed told the US banks that they have a dividend cap for now and that they are banning buybacks until the recession is over. If this trend grows then maybe this is the end of the great buyback outperfomance. If you have used, or have been looking to use, buybacks as part of your screening process then you might want to track this going forward to see if buybacks go from being a great investment asset to becoming a horrible investment liability. And if you are one of those long/short people, and everyone should be, then you can probably think of a few different spread trades along the same lines of thought.
Happy Trading and Be Safe,
P.S. If you liked this then take a free two week trial of our service. If you have any questions send me an email or find me over at Twitter @DavidTaggart
