
Not All Indices Are Created Equal-Breaking down the SPX, NDX, and R2K
In the last few years, even before the virus, you have probably seen pieces talking about the narrowing of leadership in the indices, usually in reference to the SP500. While we have indeed see a lot of that as the big companies get bigger, one of the more misunderstood issues is how the popular indices are even constructed and what they hold.
The SP500, NASDAQ 100, Russell 2000, and countless other indices are market-cap weighted. What this means is that the bigger the company the more weight they get in the index. This can matter for a host of reasons but for our discussion here it is because you want to know what you are actually trading. If you’re trading the SP500 either with futures contracts, mutual funds, or ETF’s is would seem obvious that you want to know what you are betting on. Despite this, we have found that many investors are blind to the degree to which different indices are beholden to different companies and sectors.
If we look at the SP500 right now it should come as no surprise that five of the top 10 holdings are technology firms, and while technically they are in IT (MSFT and AAPL), Consumer Discretionary (AMZN), and Communication Services (FB and GOOGL), they all have far different business models than traditional brick and mortar stores and this matters right now more than usual.
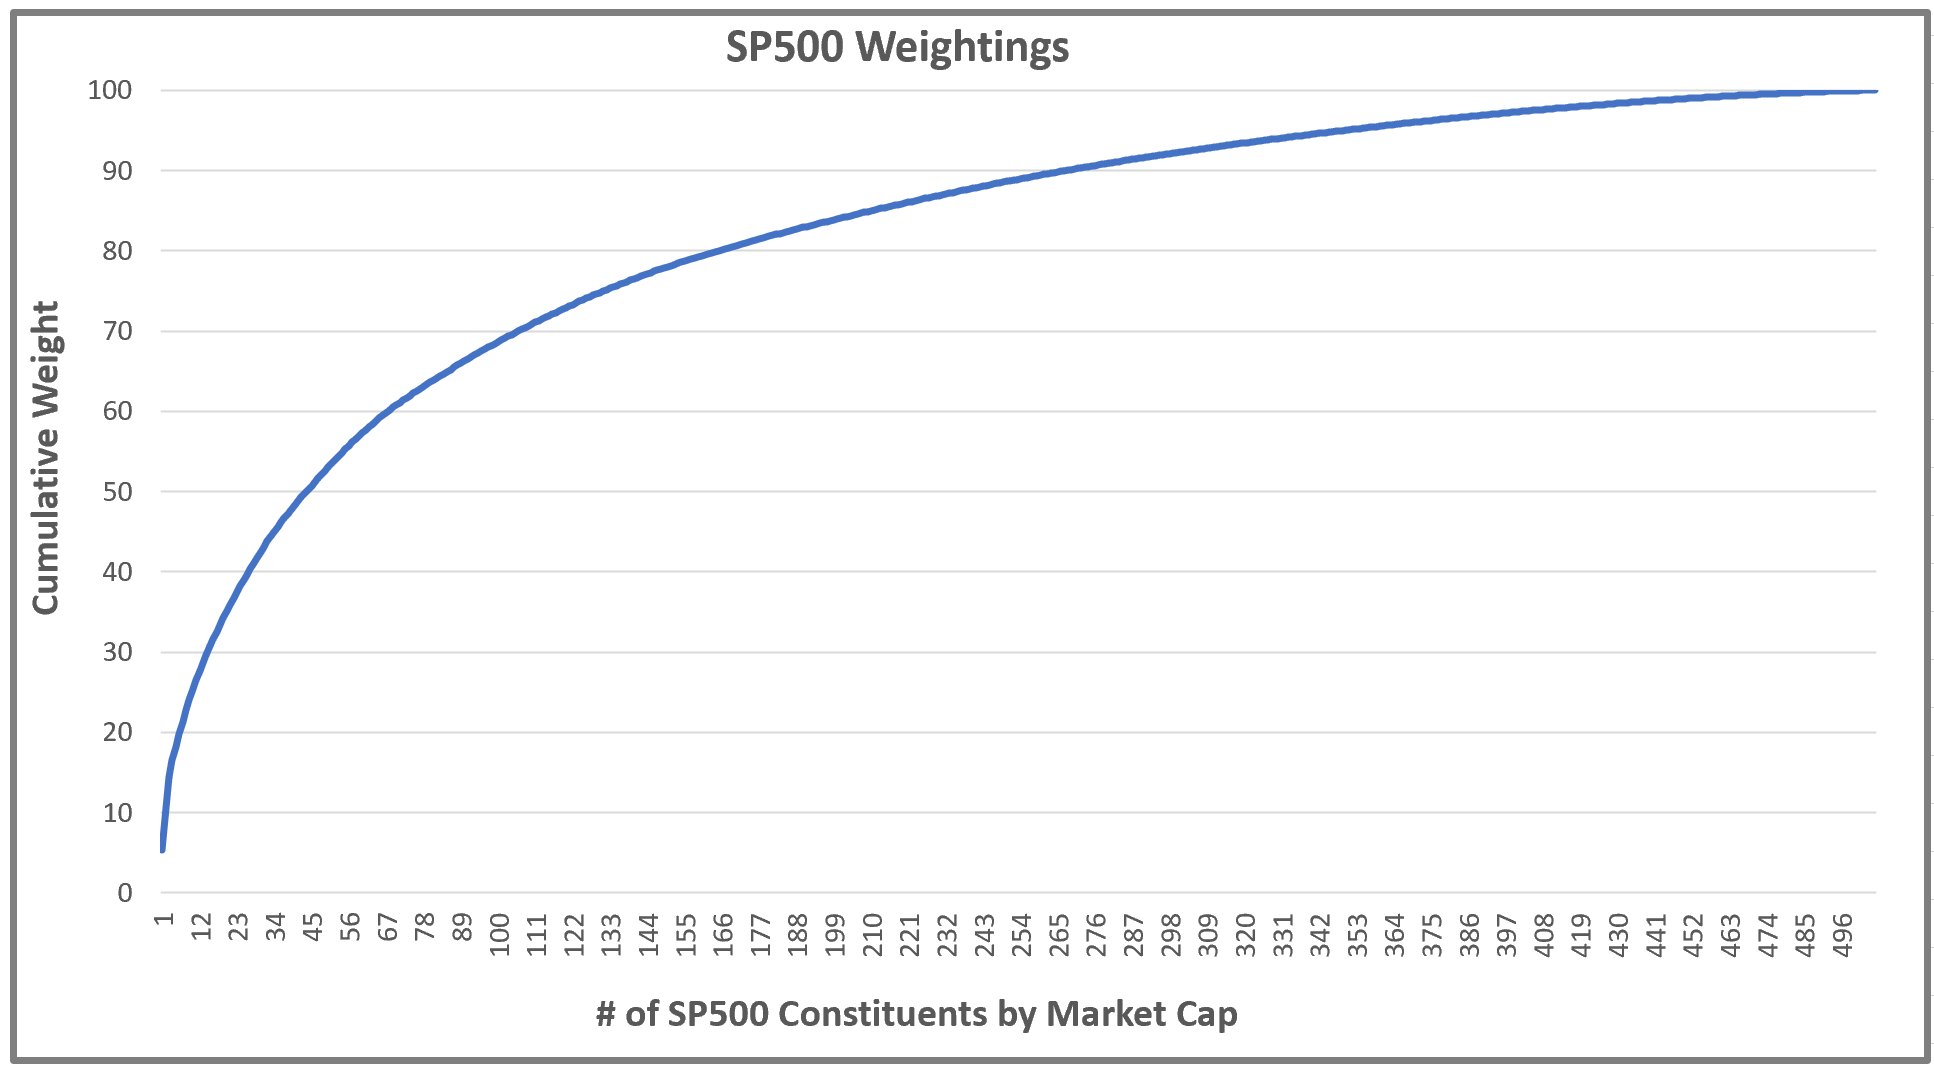
So how concentrated is it? Well the top 10 holdings out of a 500 stock index count for 26.47%. Yes, that means that 490 other companies have to split the remaining 73.53%. The top 15 companies make up 30.73%, the top 27 companies get us to 40.36%, and you only need to hold 44 companies right now to get to 50.24%. So 456 companies have the rest. The bottom 100 companies only account for 2.48% of the index, the bottom 200 account for 7.39%, bottom 300 15.43%, and the bottom 400 only 30%.
In the chart below you can see how fast the line moves higher for the first 150 companies or so before it almost flattens. Market-cap weighting does what it says but when the top companies are SOOOOO much bigger than everything else you have the nose of the dog wagging the whole thing. MSFT and AAPL together are 10.59% of a 500 company index. So it obviously pays to know how concentrated it is and what it is concentrated it.
Another part worth noting is that you don’t just want to know what the big weights are but how they are, and are not different from the rest of the index. The virus has put the importance of this up on a billboard is shining lights as technology firms where the workers for the most part just need a computer and an internet connection have done extremely well, and companies where people need to come in and make widgets, sell you things, or visit clients face to face have been killed. Even with the big rebound from the March lows a lot of them have lagged in a big way.
You also want to pay attention to the fundamentals of the big weightings. For instance the SP500 is about as concentrated as it was at the peak in 2000 but these companies are in fact different. Yeah they are not cheap on a valuation basis but they are all very profitable and they all have boat loads of cash. Actually if it was cash the top 10 companies in the SP500 would need a boat that can handle 7,154.4 tons, because one billion in cash weighs roughly 11 tons and the top 10 companies have 650.4 billion in cash.
So if you are going long the SP500 right you are largely going long 10-44 companies depending on how granular you want to get (44 companies get you to 50.24%), and nine of those companies together have $650.4 billion in cash. Obviously cash is far from the only metric that matter but it does go to show that they are not weak companies who go out of business one week into a shut down. Fundamentally on the expensive side but also fundamentally strong. Other considerations of course would be political power, global footprint, etc.
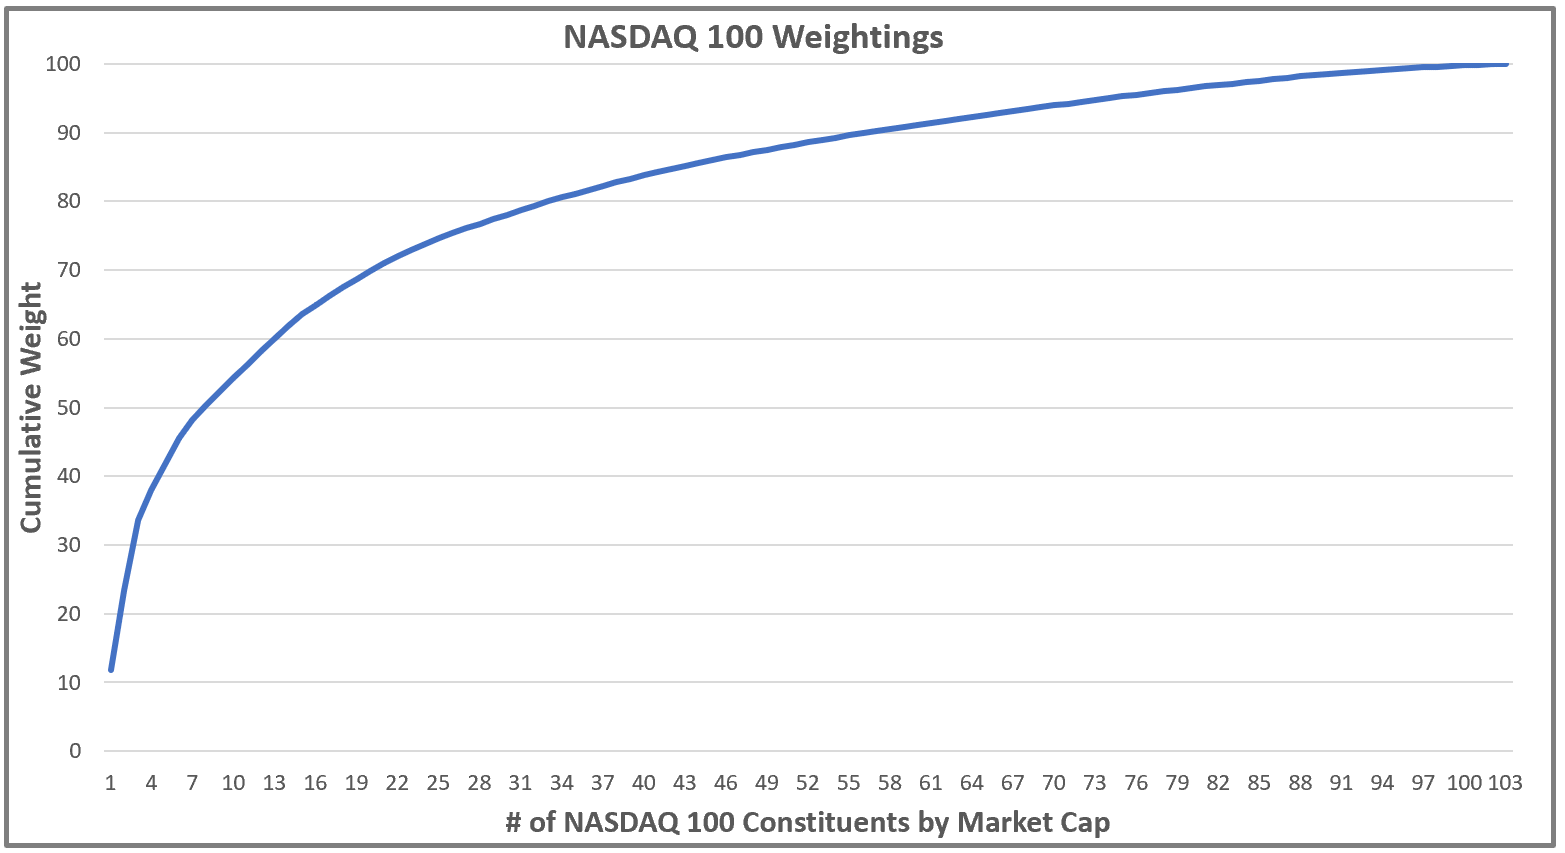
Looking at the NASDAQ 100 shows similar and yet very different characteristics. You only have 100 companies, they are almost all tech, there is a LOT less money tied to this index, etc. The SP500 has several stocks in each sector while the NASDAQ 100 is only in a few of them.
Because of this the concentration is even higher. Here AAPL is 11.89% of the index, MSFT is 11.54%, and AMZN is 10.2%. So three companies constitute 33.63% of the index. It only takes seven companies to get to 50.37% of the weighting in the index. And it only takes 33 companies to get over the 50% mark. If you just want to be “long tech” then being long this index is a decent way to go, but if you dislike just one of the top seven companies you might be better off just buying the other six and calling it good.
Concentration at this level is important to know and trade around. Also as mentioned earlier this index is different from the SP500 because there are not nearly as many products tied to it, and consequently there is not nearly as much money, or as many strategies, messing with it. SP500 has more derivatives and derivative products than any other stock index so sometimes it will move because of a hedge or some other technical factor that has little to nothing to do with the actual constituents of the index.
In this piece we are going to look at one more index, the Russell 2000. As you may have guessed the weightings are drastically different that the SP500 or NASDAQ 100 because it both holds 2000 stocks AND is focused on mid and small cap stocks. Since market-caps essentially run under a power law the farther down you go the less of difference between one company size and another. In the Russell 3000, which looks at large, mid, and small caps, you only have to get to company 59 to account for 50% of a 3000 stock index. Power laws are a thing in the world of market-cap weighted products.
In the Russell 2000 you have to go down 105 stocks to get to 25% of the index. The top company TDOC currently only holds a 0.77% weighting. Contrast that with AAPL’s 11.89% weight in the NASDAQ 100 and AAPL accounts for 15.44x more to the 100 than TDOC does to the Russell 2000. In fact as the chart below shows you have to go out 716 companies to hit the 80% of the index mark.

Small and mid caps don’t really have a lot in common with the large caps. In fact the larges caps don’t have a lot in common with the mega caps. The mega caps move the market, have all the cash, and have all the political power. Consequently they can trade very differently from other indices during different macro environments. In an economy that is only a few steps away from a winner take all environment, knowing what you are actually placing a bet on can be the difference between making money and losing money. And for all the factor junkies we are not just talking about the size factor but what the size and power differentials entail.
I will leave you with one scenario. In a market where the Fed, Treasury, and seemingly the legislators are in bailout mode, and yet the current economy is holding on by a thread, what index of the three we covered would you want to be long? What index would you want to be short? If your answer is the same index then please go back to the beginning and reread this whole thing. Not all indices are created equal, nor are they created for the same bets.
Happy Trading and Be Safe,
P.S. If you liked this then take a free two week trial of our service. If you have any questions send me an email or find me over at Twitter @DavidTaggart