
Gold, Inflation, and Killing Sacred Cows

Gold has been an issue for centuries. Whether you were wandering the desert back when Moses went up to Mt Sinai, a miner losing his shirt in the California gold rush, or an investor today it has been hard to know what the truth about gold and what you should or should not do.
Just like in the time of Moses there is a lot of misinformation out there. Most of it is well intentioned but sadly more than a few pieces are totally self serving and is just a veiled sales pitch from the messenger. Have you noticed how many gold bulls sound like a realtor, meaning it is ALWAYS a good time to buy gold? If you own a gold brokerage you would also start to sound like that over time. Of course if you have a gold brokerage you are a seller of gold and not a holder of it. But you get to keep your percentage of each transaction. Other unrepentant gold bulls prey upon your fears and say that gold is the way forward, fiat currency is all trash, and that since gold has been around forever it is the only real currency. There are some definite store of value characteristics with gold but you can not buy groceries or pay your mortgage with it. And in the meantime even when you just hold it the value goes up AND down. Would it surprise you if in the end, like all commodities, gold is a trade and not a buy and hold instrument? There are times to own it and times to sell it.
As you may have guessed I am not a died in the wool gold bug. At the same time I am not a perennial gold bear either. It has its purpose, but it is not the #1 asset ever made. Oh and it also won’t save you in an end of the world as we know it scenario. In that situation you are better off with stores of food, water, lead, and high velocity lead dispensers. But that is a topic for another day.
In this piece I want to look at inflation and its relationship to gold, if there even is one. If you love gold your jaw may have just dropped. After all gold is sold as the ultimate inflation hedge. Well we have data so instead of saying something, and repeating it over and over until people believe it, we can test it. Like a clickbaity headline on the internet “We tested gold and inflation and you wont believe what we found!!!”
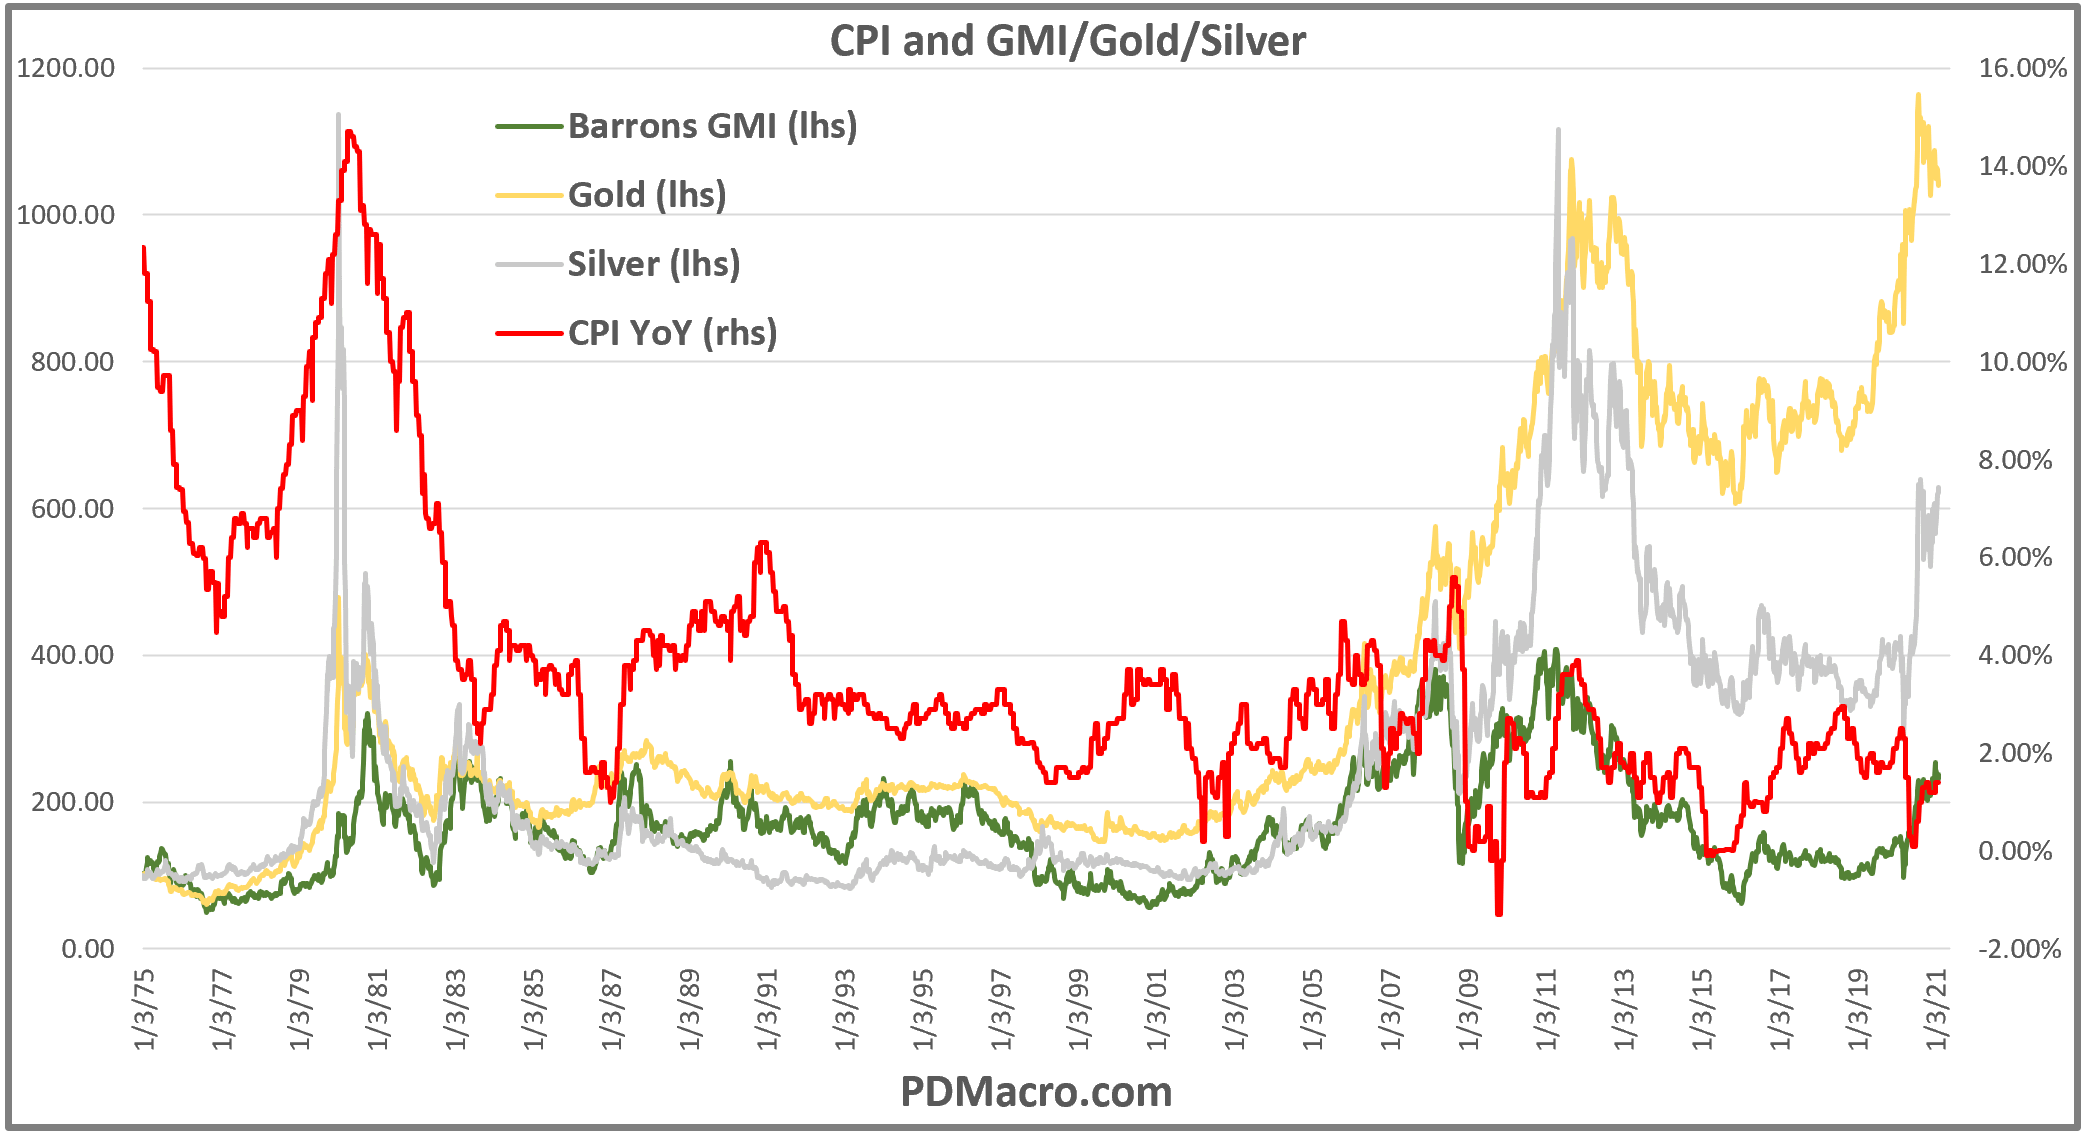
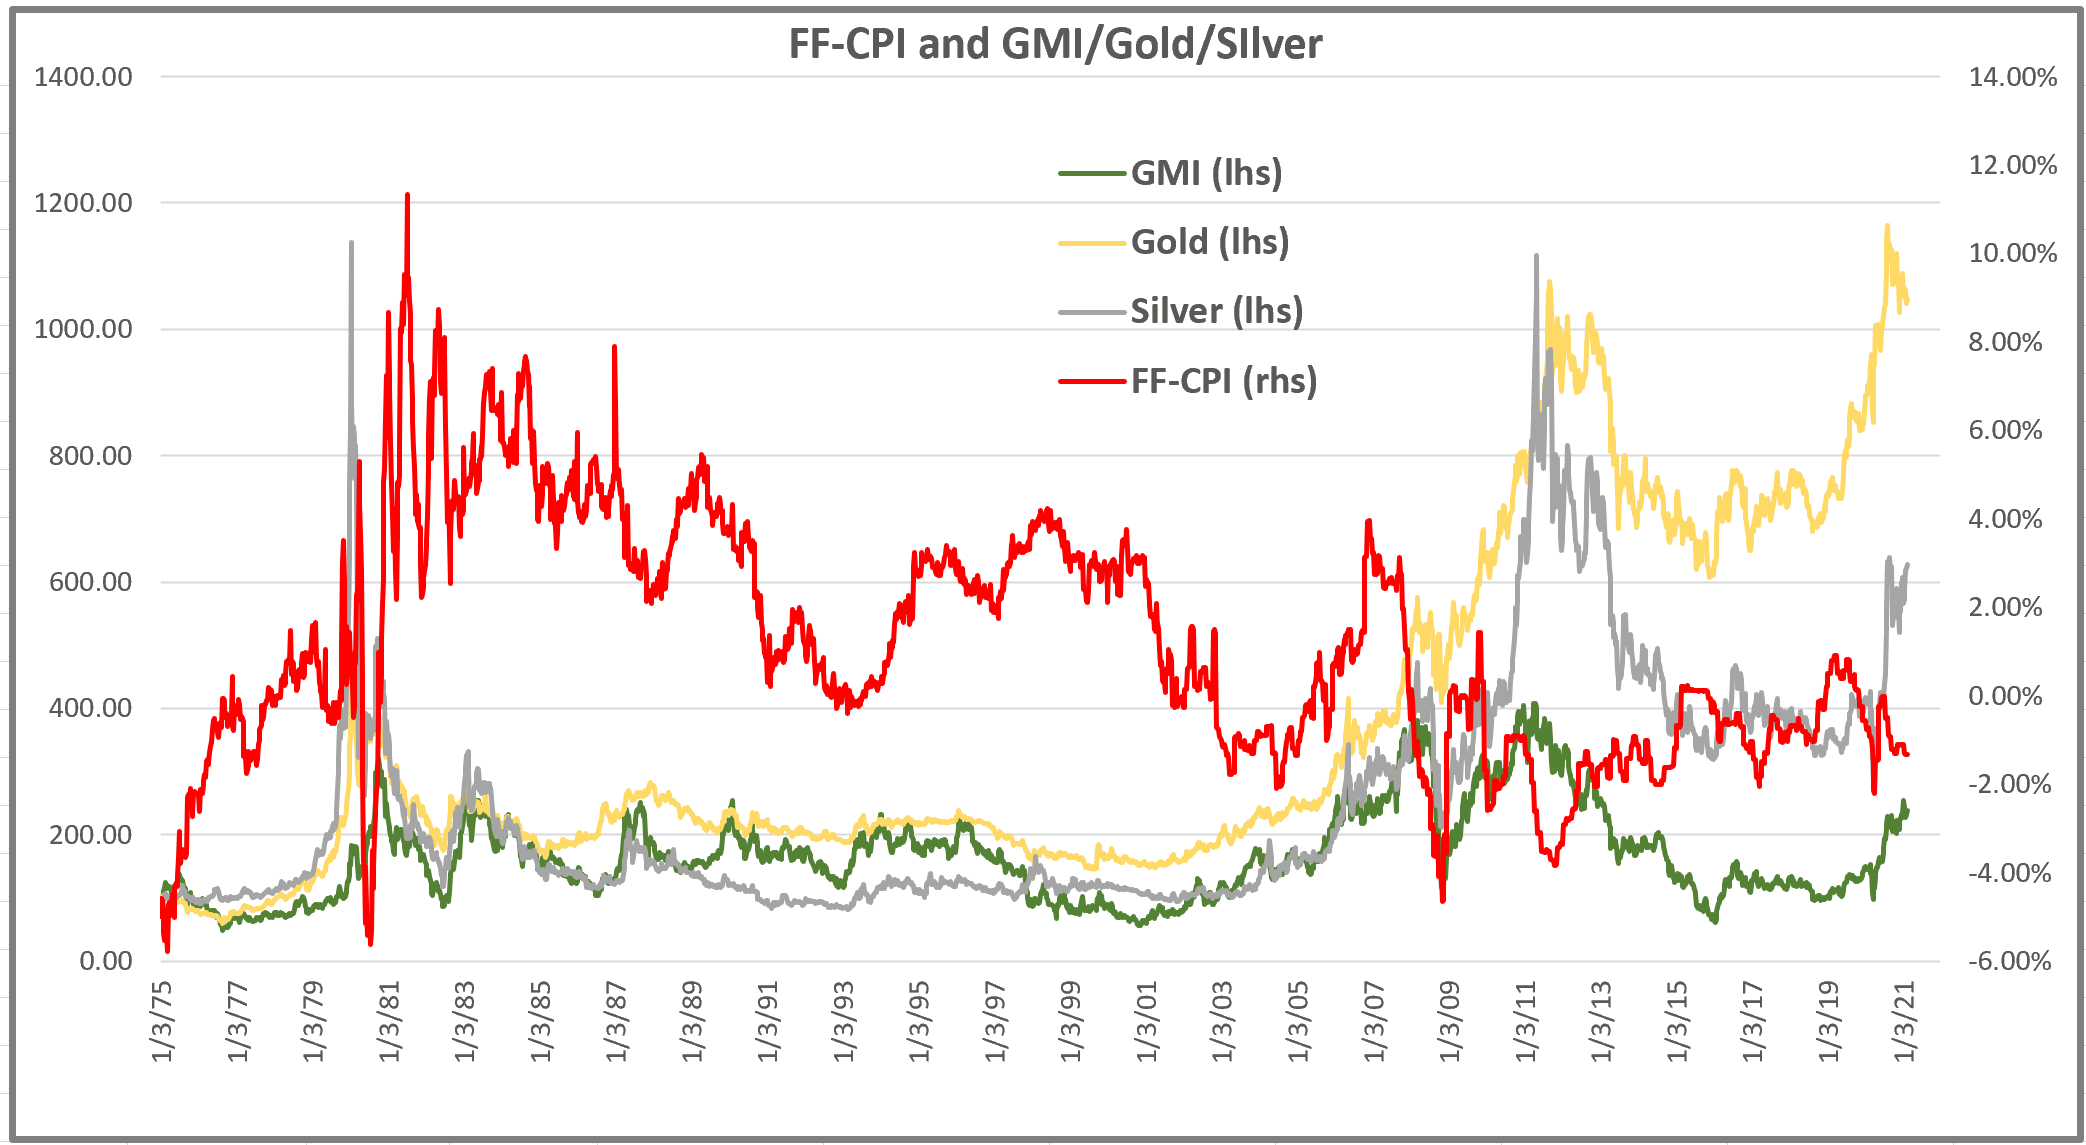
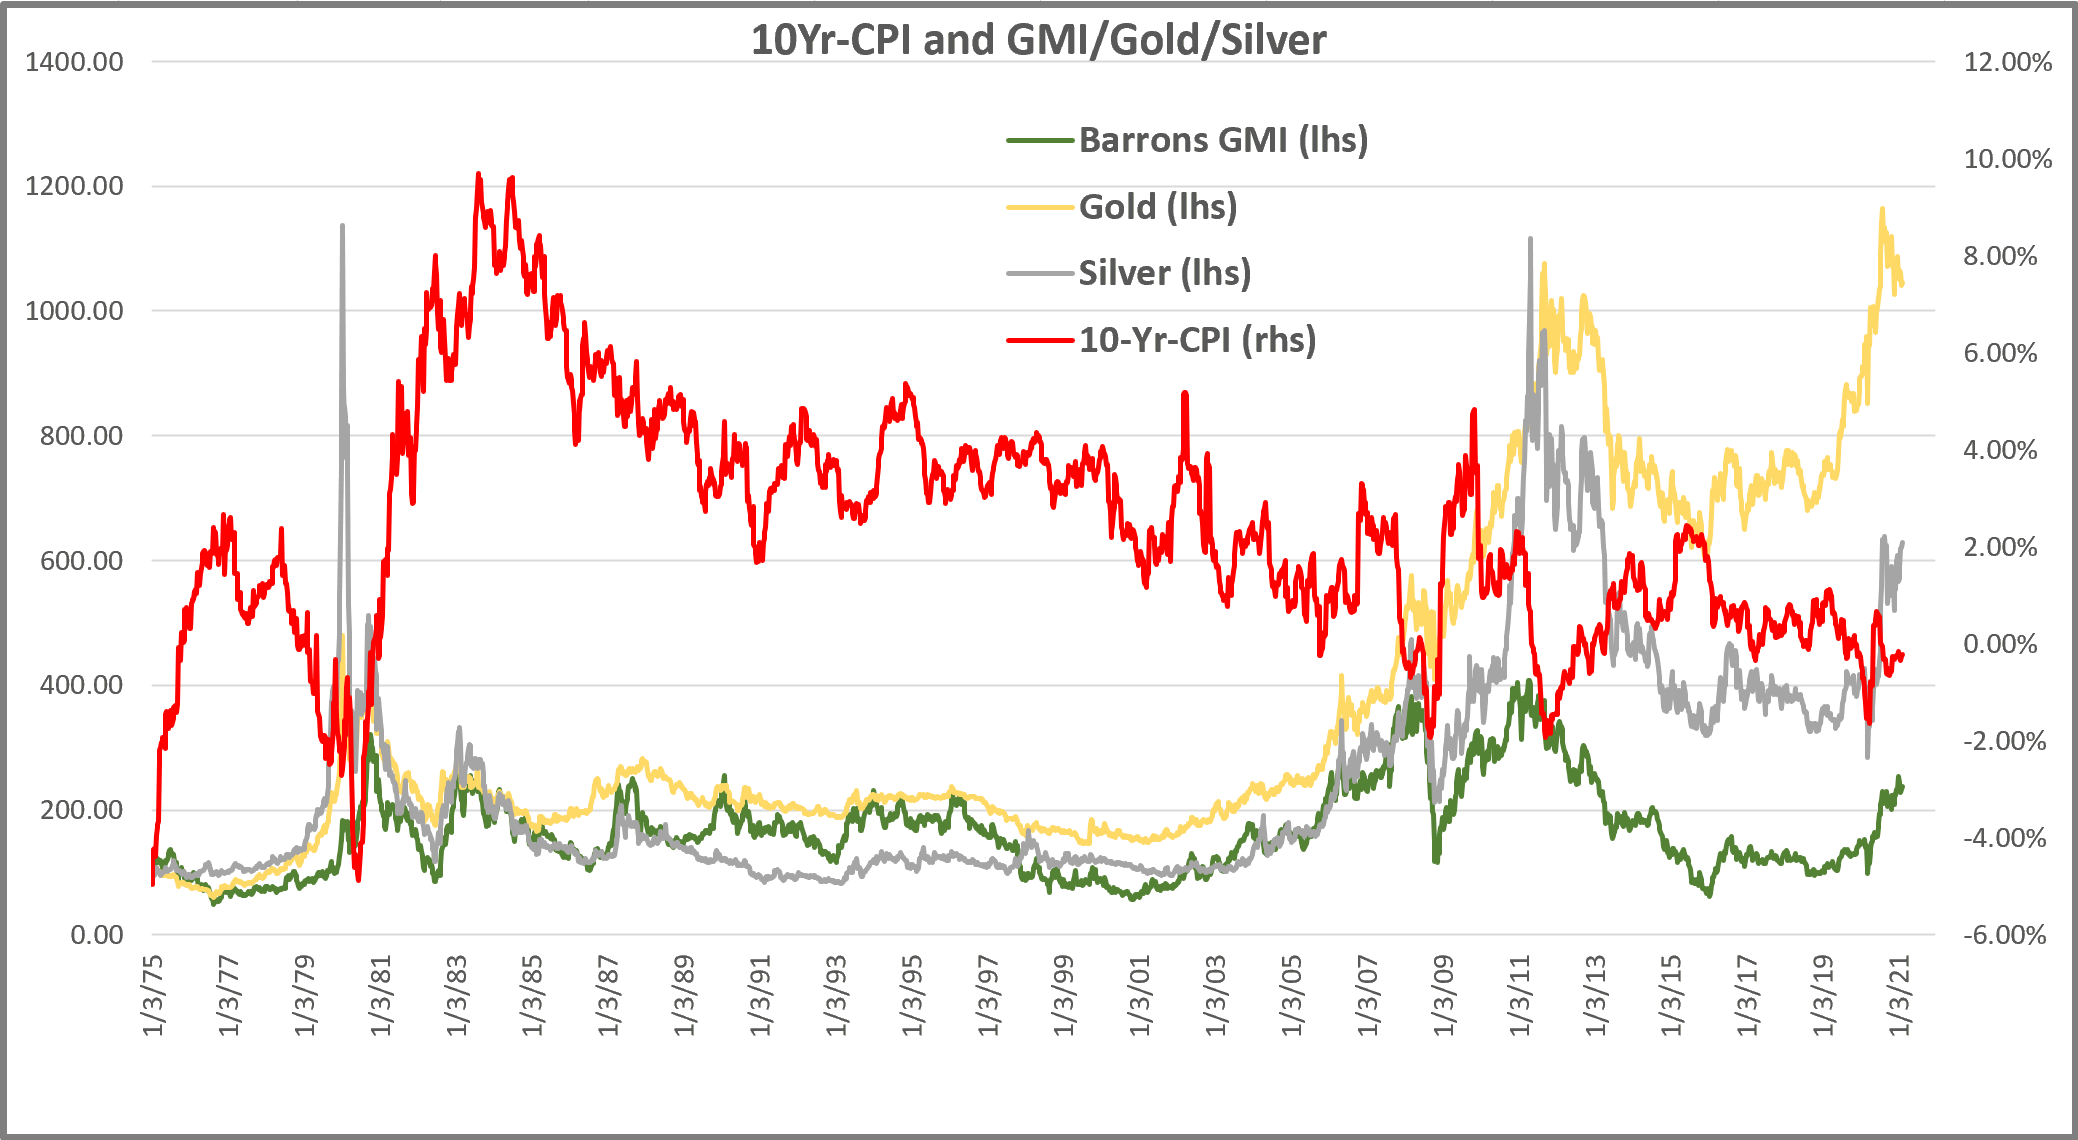
In this first chart we have the year over year percent change in the CPI-Consumer Price Index, the most popular inflation number, and then gold, silver, and the Barron’s gold mining index all rebased to 100 from 1975 to now. We used the Barron’s GMI-Gold Mining Index because we have data going back to 1975 for it while we only have data to 1979 for the CAU-Philly Gold & Silver Index. They are extremely correlated though so you could replace one with the other to test any of this and achieve the same conclusions.
As you can see in the chart back in the 1979-1980 period we saw a big spike in gold and silver that went along with the big move in CPI. This is the selling point for a lot of gold bulls who sell the “gold as THE inflation hedge” narrative. Yes, gold went up with inflation in 1979. But if gold moves big on inflation how do you explain the big gold bull of 2002-2011? We had a small bump up, a crash lower, and then another moderation in inflation and yet gold went up and up. What about the 1987-1990 period? Inflation went from 1.30% to 6.30% and yet gold actually went down. Hmm…
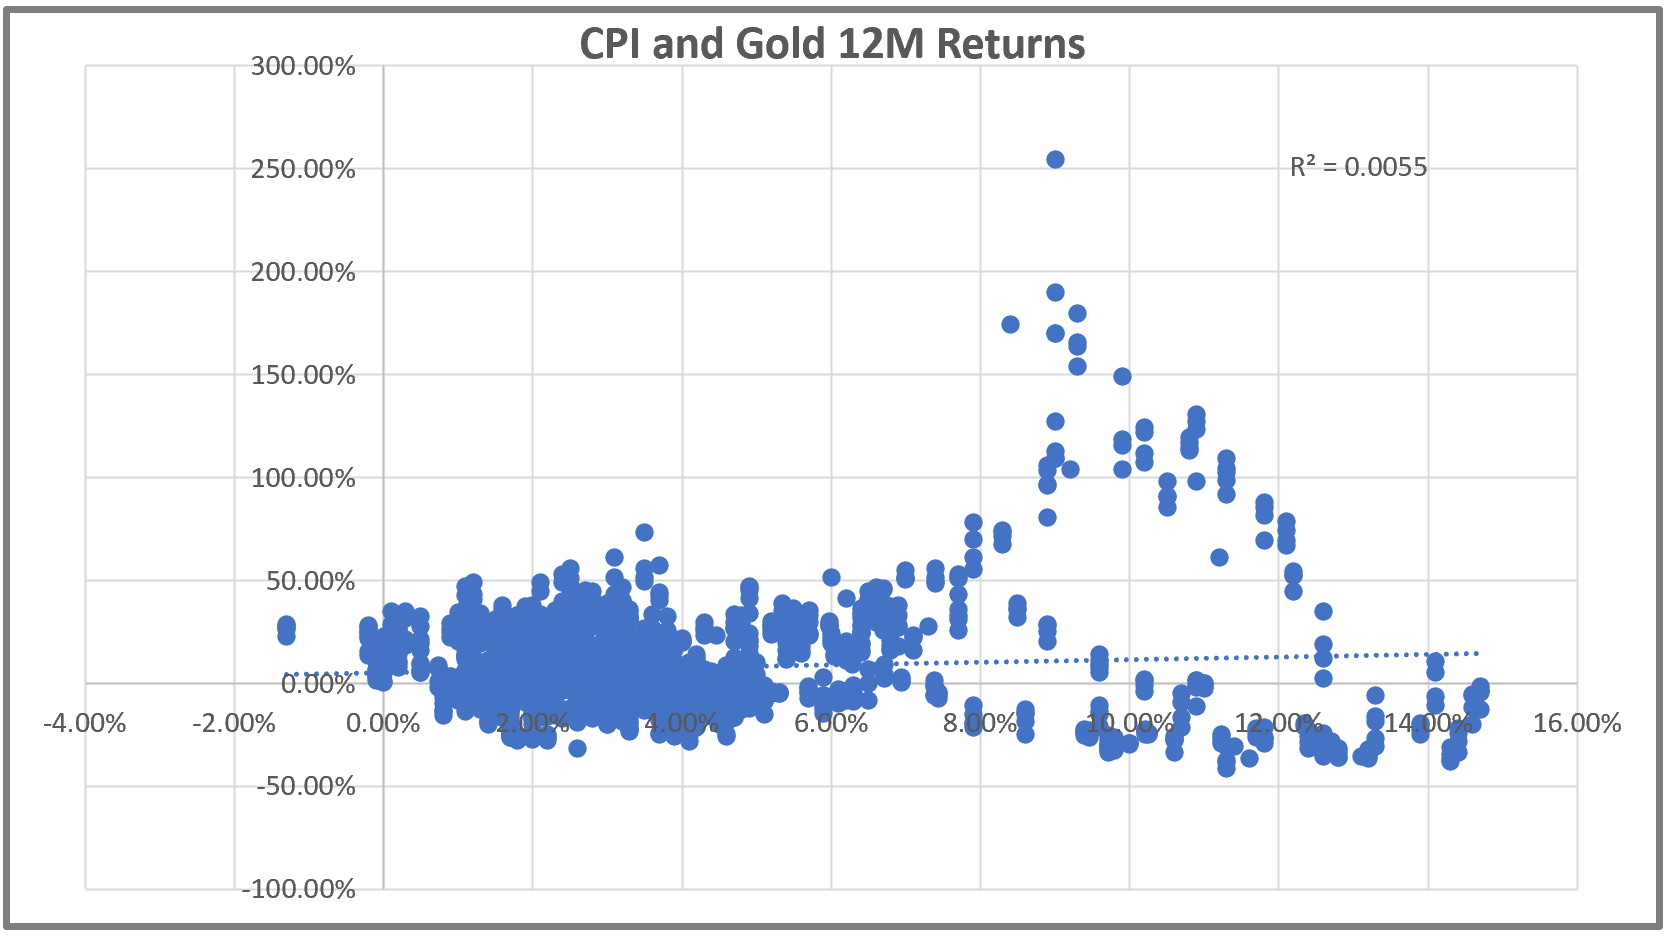
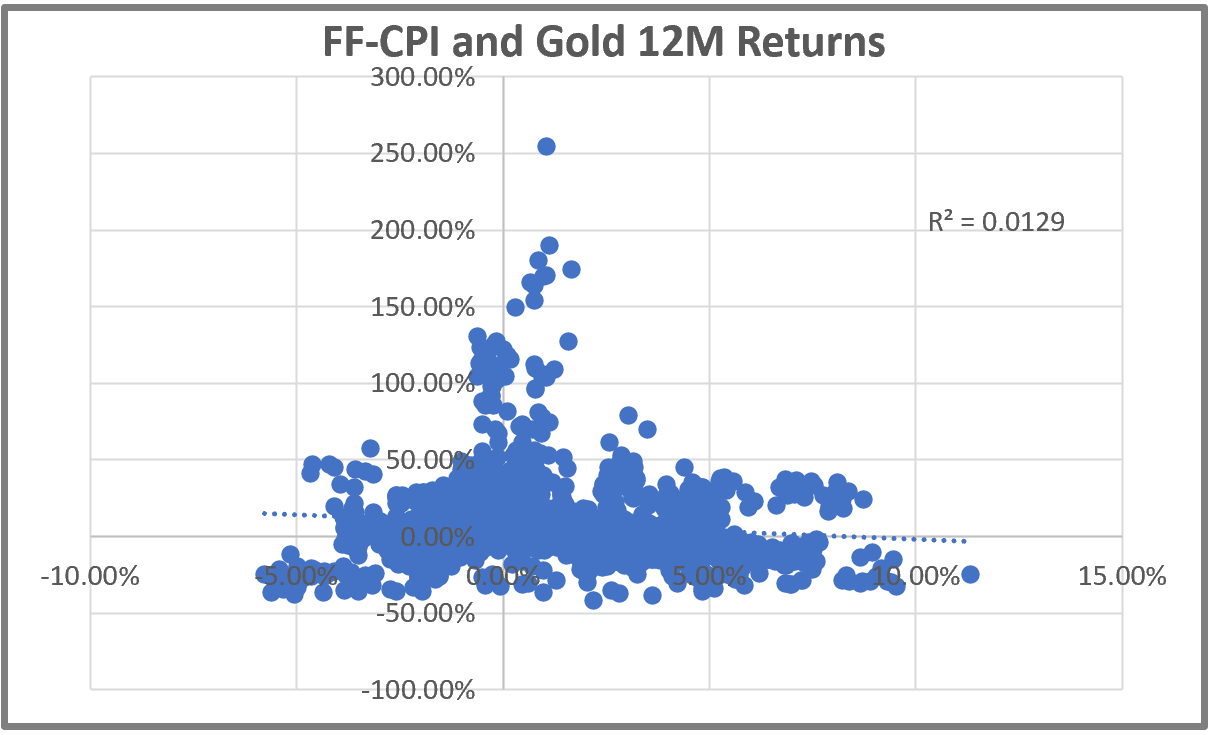
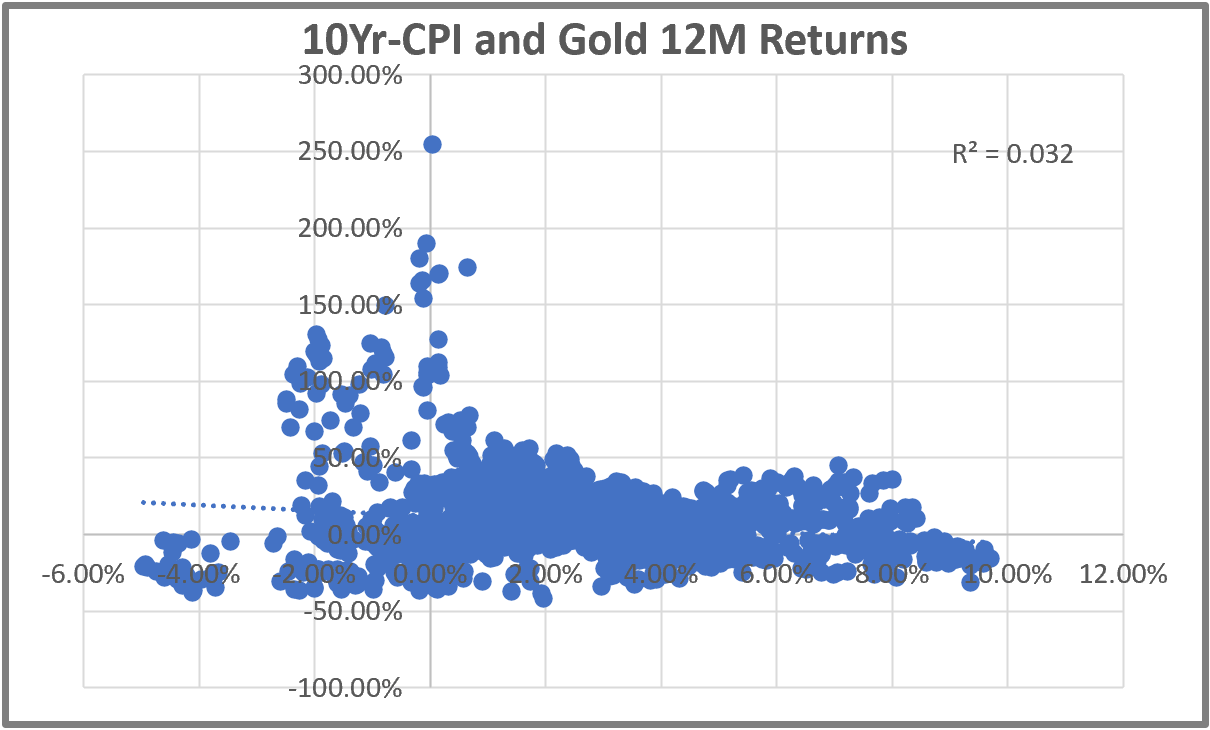
So it seems like inflation has an ever evolving relationship with inflation. Lets look at another thing. Can using the inflation rate help up determine gold returns 12-Months forward. If inflation is X% then how does gold do over the next 12 months? In the chart below we use a scatter plot and then plotted the trendline and put in the R2 value. As you can see returns are all over the place. The largest, most dense, cluster of dots is in the low inflation zone in the 2-4% range. We also have the dots from the 1979-1980 period over in the 9% area. If you go to the higher inflation rates returns actually skew slightly negative. So literally the highest rates of inflation were followed by flat to negative returns. Buying gold based on inflation readings turns out to be a mediocre strategy. And with a R2 of 0.0055 it is like saying you have an edge in coin flipping. I guess anything is possible.
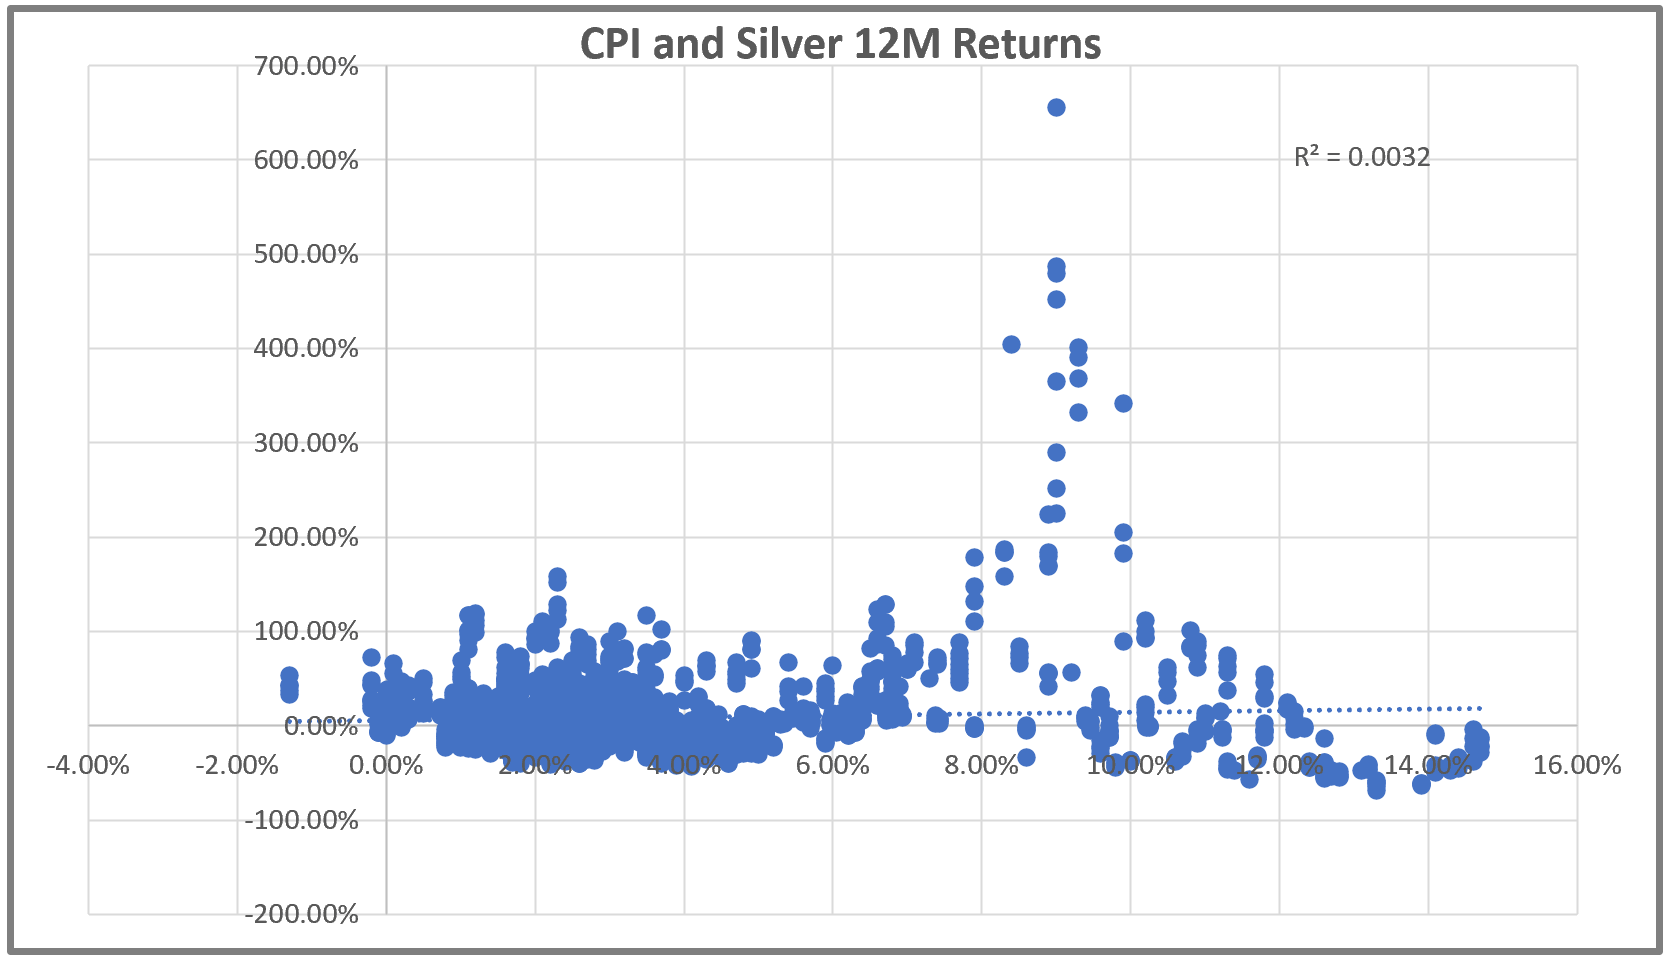
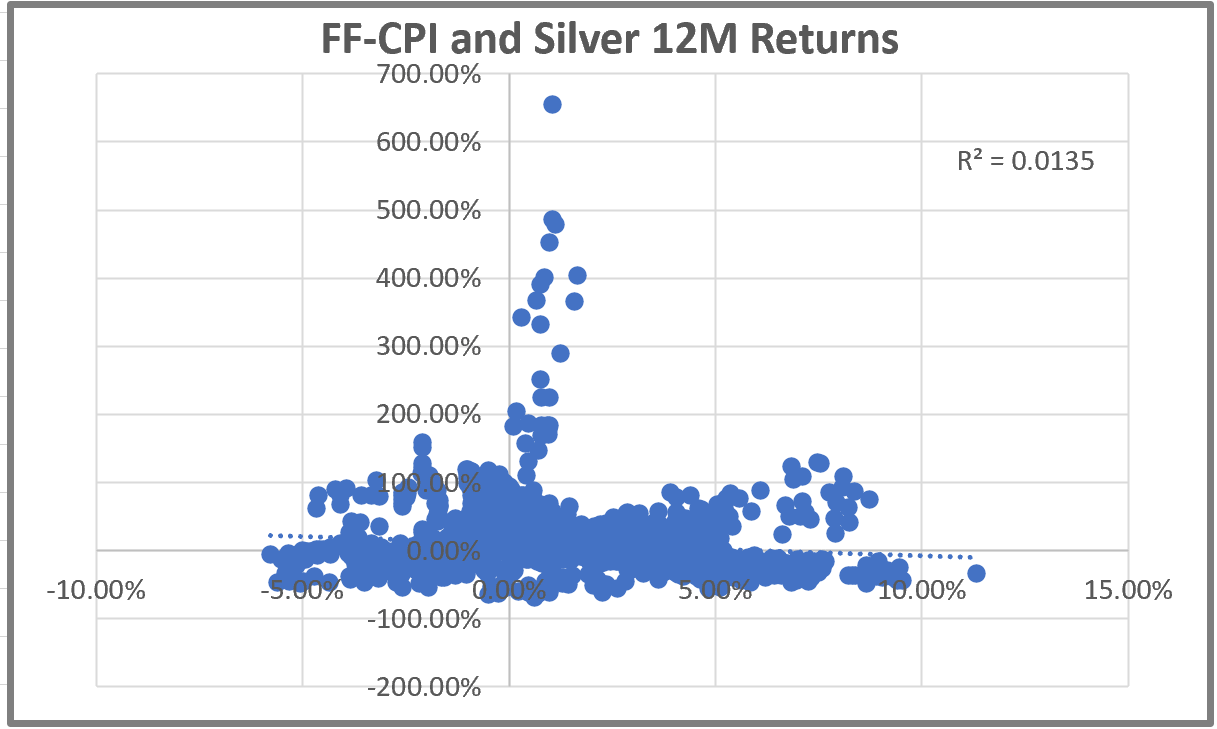
What about CPI and forward silver returns? This one is a fun chart just because the one outlier, the pillar of dots in the 9% range, was not formed by inflation, demand for jewelry, or demand for silver as an industrial metal. No, in this case it was three oil brothers from Texas, the Hunt brothers, who tried to corner the market in silver. They ran silver up a LOT and then lost about a billion dollars as the margin rules were changed (visions of GME probably just danced in your head) and the price came crashing down. But even with that crazy part of market history the relationship is just short of non-existent. High CPI does not lead to higher silver prices and low CPI does not lead to lower silver prices. I already used the coin flipping analogy so how good are you at rolling dice?
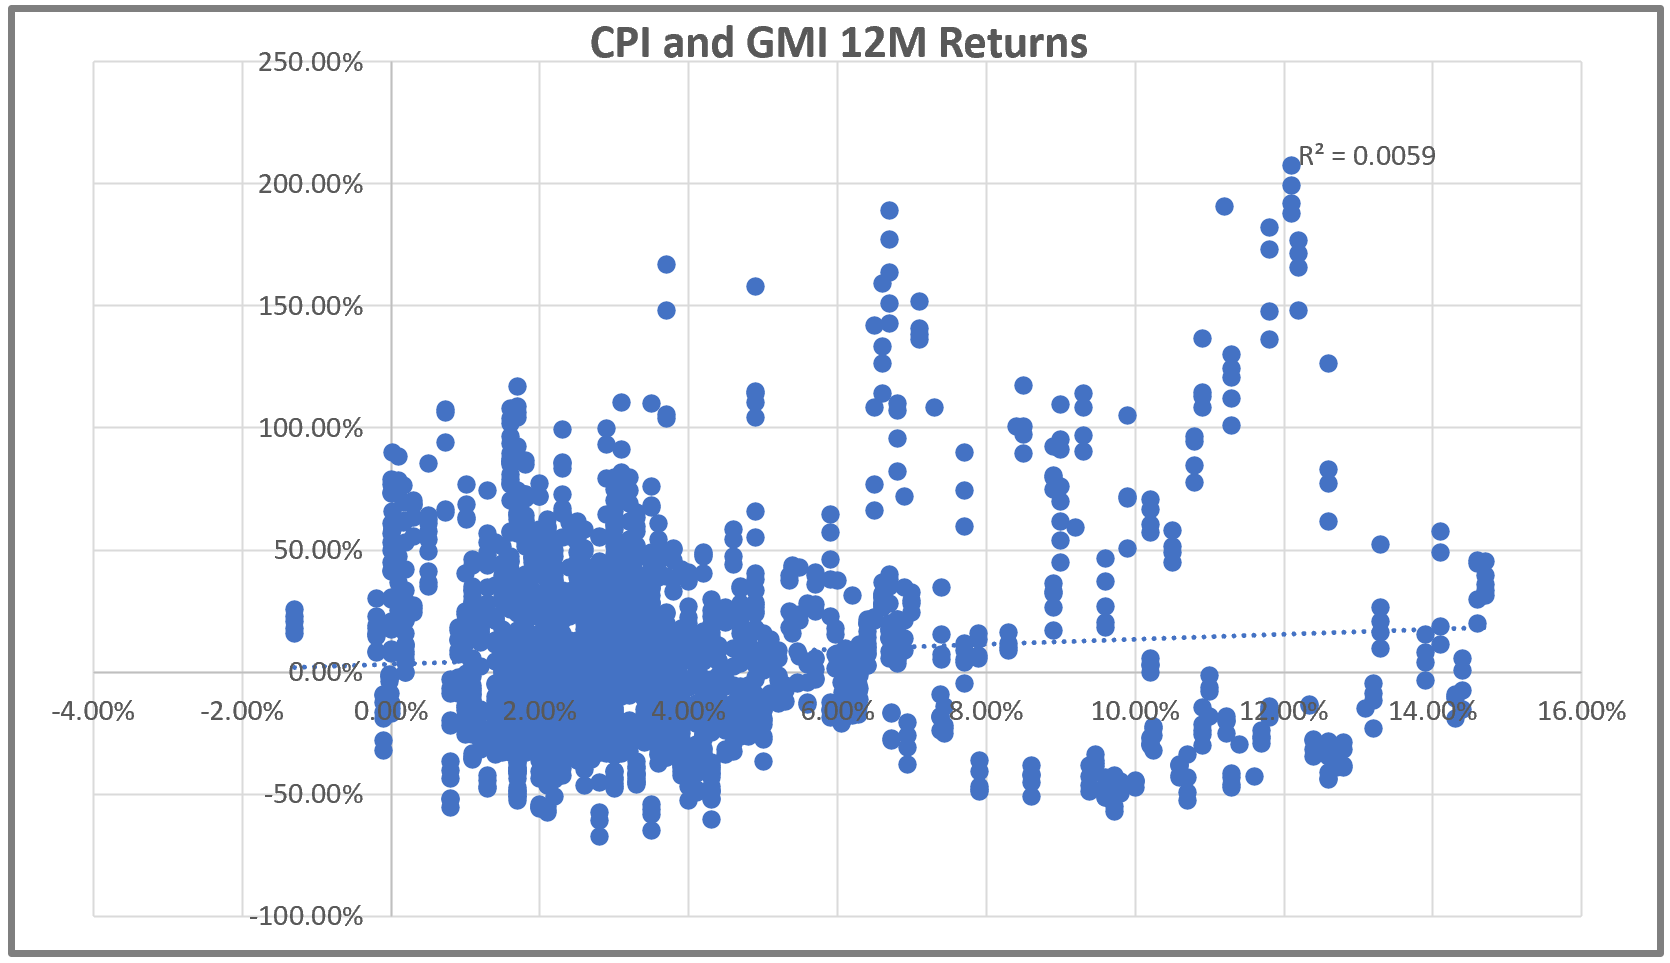
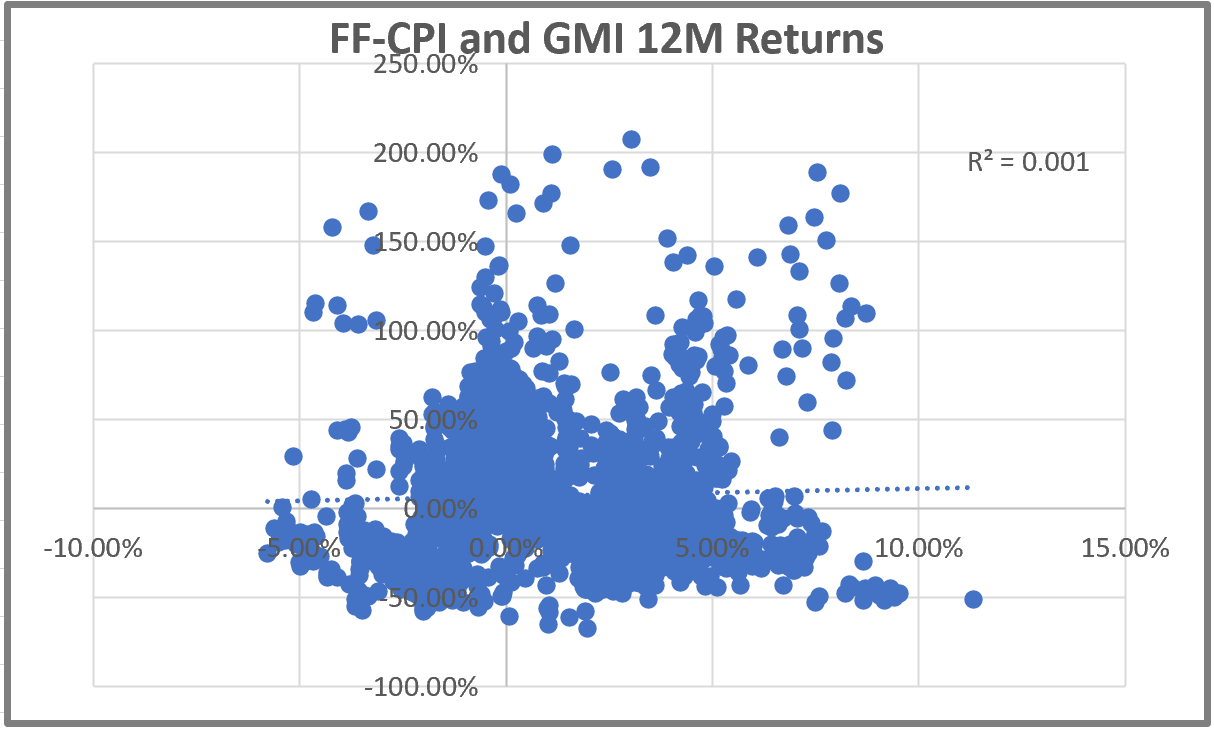
Finally lets look at CPI and the returns of gold miners going forward. After all gold miners actually produce (ok mine but for these purposes it is the same thing) gold and sell it. maybe they do better? Well they do a bit better, but we mean a bit. A R2 of 0.0059 is like that one time you did a round of golf and were only 2 above par when you are usually a 30 handicap. You might be a better bet than the guy who only hits the ball out of bounds but really you should not be betting on your golf game. Getting serious again (we were serious. Seriously if your handicap is 30 then that is not the sport to bet on yourself) look at the chart and realize there is a dot for every week since 1975. The outliers tend to be strong positive returns but really almost all the returns are clumped down in the 1.5-4% CPI range…in other words just rides along with most of the last 40 years.
So inflation by itself appears to be at best a mediocre way to decide if gold, silver, or gold miners are a good investment. What about other ways to look at it? Well one tool that involves inflation that does have a bit more value, and at times a lot more value, is the idea of real interest rates. If gold is a store of value then it would make sense that it has to compete with a savings or money market account where your money is just sitting there. If rates are high then putting your money in a savings account can make sense, but only if the interest rate is higher than the inflation rate. A 5% savings account during 6% inflation generates a negative -1%/yr return on your cash. Not awesome by most peoples standards. If on the other hand the interest rate is 5% and inflation is 1% then you are earning 4%/yr for existing, and in a FDIC insured account no less. Not exactly get rich returns but a good store of value for sure.
Doing the above, subtracting inflation from the interest rate, is called the “real rate.” If gold is a store of value then the real rate is at least one of the hurdles it has to compete with. So how does it work? There are two answers. One is “it works poorly” and the other is “it depends.” We like the latter but if we look at the historical record it is mixed enough to say it works poorly.
Here is the Fed Funds Rate minus the CPI rate, along with gold, silver, and the GMI. You might notice that it goes in and out of working really well and then flipping the relationship. But when it is working well it usually works for multiple years, a cycle if you will, but more on this later.
What do the scatter plots say about all this? Well there is a relationship here. Lower real rates have a higher positive return for gold over the ensuing 12 months, but the relationship is not awesome. The R2 is only 0.0129 for gold, and while this is a LOT better than with using CPI alone, it is still weak. But there is a slight edge here using the blunt force tool of lower real rates. Think of it like a coin that is 55/45 heads/tail odds. Don’t bet your bankroll on it but if one were forced to say buy/sell then it is better than nothing…not by much though and it might be more like 52/48.
We see the same thing with silver that we saw with gold, and also get to see the pillar of dots that the Hunt brothers gave us. Gotta love it. Still like gold the edge is oh so slight.
Finally we have the gold miners. Like the CPI test earlier this one is kind of all over the map, and the edge is 1/10th of the edge we saw in gold and silver. Turns out that if real rates are low the miners don’t seem to really care. Of course another thing worth knowing is that mines might be a good asset to own all of, and maybe owning an entire mining company is good, but being a shareholder in a gold or silver miner over time is a bad deal. When they move they move big, but that goes both up and down. Miners are always a trade and never an investment. At least that is what all the data ever put out on miners tell us. But you do you.
Finally we do a 10Yr real rate. We take the 10-Yr Treasury yield and subtract the CPI rate. Maybe the long end of the curve has some special sauce…or maybe not. Turns out that the signal here is actually a bit better. And over the last 10 years or so it has been golden so to speak. Look at the red line and the gold line (I wish I could name lines as well as Harley Bassman but I am not worthy) and you can see the almost perfectly inverse correlation of the two. When real rates are trending lower, gold has been going higher and vice versa. Maybe this one is useful.
If we look at the scatter plot this is actually the strongest signal yet. All the outlier returns have come from low and negative real rates, and a slight majority of all positive returns come in on this side as well. The main problem here is that is still a very weak R2 from a statistical standpoint. But so far this is the strongest relationship of any we have looked at.
Looking at silver the relationship weakens a bit but is essentially the same. A slight edge in buying with low and declining real rates with all the outliers in the low to to negative space.

Finally we have the gold miners and real rates. The relationship here is very weak as you can see all the outliers come at both ends of the spectrum. Negative real rates have some great returns as do high real rates. Negative real rates also lead to some bad outcomes as do high real rates. Like we said earlier, miners are a mess, always a trade never an investment.

So what have we learned? Inflation by itself tells us very little about the future direction of gold. Yes, in the 70’s high inflation and gold went hand in hand…but was it because of inflation? Huh? Yes, you read me right. Maybe gold went up for a different reason, or for a combination of important factors.
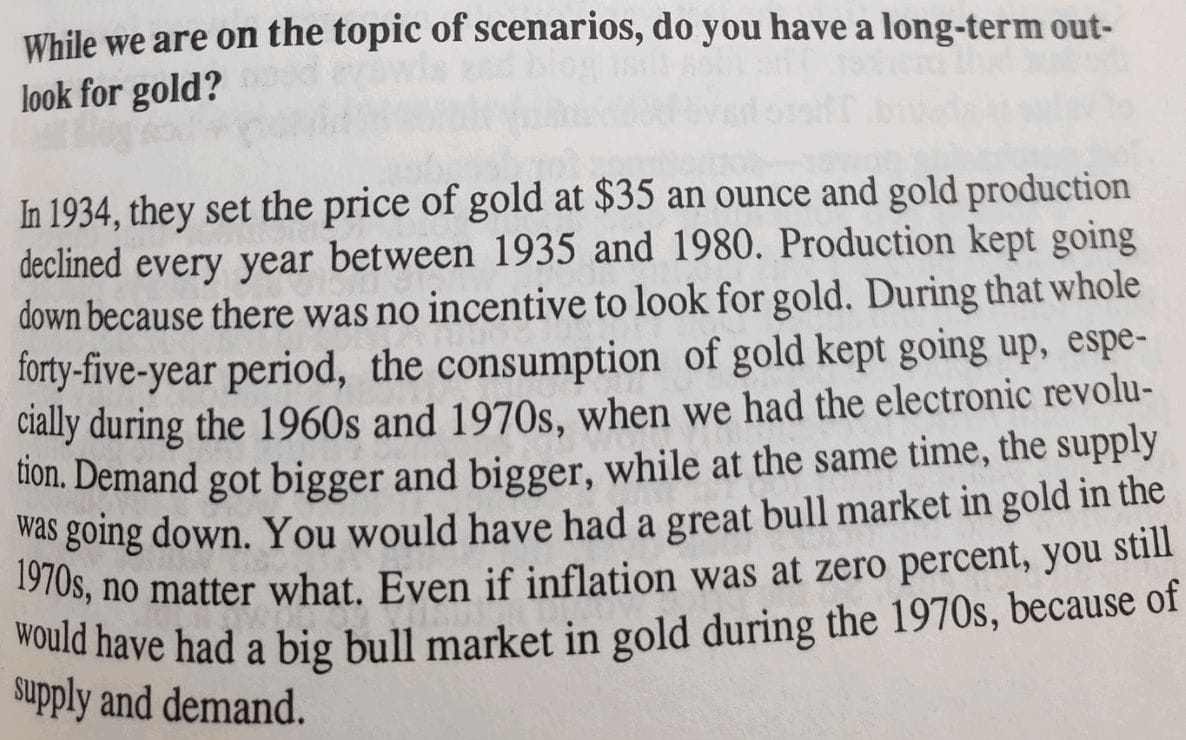
We had the gold standard from 1931 to 1973. As Jim Rogers pointed out in the first Market Wizards book the reality is that gold had a MASSIVE supply demand imbalance in the 70’s since no one had been incentivized to mine gold in 45 years. But people still wanted to own gold as an investment. So when Nixon ended the gold standard the floodgates were opened and investors bought while miners lagged by a few years to catch up with demand, it takes a long time to make a new mine. Add this to the inflationary dynamics in the late 70’s and you had the recipe for truly insane moves in all commodities, not just gold. So did gold go up because of inflation or because gold had been artificially kept low for so long? I tend to think it was due to a hefty dose of both. Inflation alone doesn’t make gold a desirable investment. (read the piece below, it is worthy of you time)
The other thing we learned, well aside from miners being a long term money burning machine, is that real rates have some value. In all of our testing we have found a few things that work well on gold. Real rates, trend, and narrative. The first two can be easily quantified but the last cannot be, or at least we have not figured out how to. Oh and as is always the case, you need to add strong risk management into all of this.
But if you have gold and silver in uptrends, real rates declining, and the primary narrative that real rates matter, then gold usually goes higher at a decent clip. Another tool, or an offshoot of the real rates we have used in this piece, are the other ways to measure real rates and future inflation. TIPs, the 5yr, 5yr forward expectation rate, and similar tools are a more refined way to look at real rates and at least in the history we have are actually superior ways to look at real rates. The problem for testing however is that the 5yr5yr only goes back to 2003, TIPs back to 2003, and similar tools also have similar limits with their historical data. Since the late 70’s-early 80’s were such an important time for precious metals we wanted to look back as far as we could. Most likely the newer tools, and we do have about 18 years of data now, will hold up well going forward.
Anyways
If you have read this far then you should be well armed the next time somebody comes screaming about gold, or trying to scare you saying the Dollar is worthless and you need more gold, to look at what they say vs what the data says. I will go out on a limb and say the data will not match up with what they say, for whatever reason that is just the way it works. Gold is for jewelry and for trading, not for investing.