
The SP500 and Mid-Term Years
One of the most anticipated events on the calendar for 2026 are the US Mid-Term elections. Now that we are almost two months into the new year, and with the State Of The Union address just a day away, let’s look at what markets do in mid-term years
Before we get into mid-term specific years let’s look at how the “average” year actually looks like. After all we want to be able to benchmark against what usually happens.
This chart is of every year from 1930-2025. Despite an “average” year returning 7.88%, the reality is that almost no years are in the 7-8% zone. Instead, we have a lot of years far higher, far lower, and ending up kind of flat. There is a definite upwards bias, but the “average” is rarely hit. This is worthy of its own post, but for now just realize that for scenario building, using the average is only a starting point.
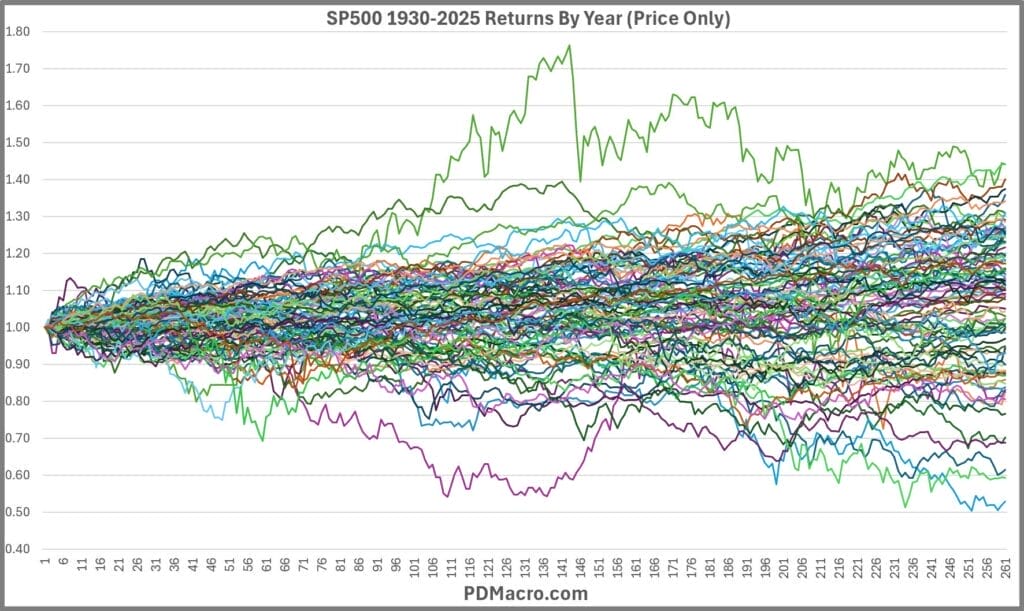
We are breaking down the years with two different time periods. One is all the data we have for the SP500 from 1930-2025 and the other is the post-WW2 era. We like using all data, but a lot of people want to take out the Great Depression as they view it as an anomaly, and some look at post-WW2 as the modern era.
Looking at 1930-2025 we can see that the average year delivers +7.88% per year. You can also see that for the most part the average is quite smooth with an average worst drawdown of only -1.52%.

If we look at the post-WW2 era, we get even better returns with +8.96% per year and an average worst drawdown of -1.06%. Funny how returns improve and risk drops when you take out the Great Depression.

With all that as our backdrop-average returns of +7.88% and +8.96% and average worst drawdowns of -1.56% and -1.06%-how do mid-term years stack up?
From 1930-2025 the average mid-term year delivers +2.83% per year with a worst drawdown of -4.95%. Worth noting is that the average mid-term year sees a lot of chop and is negative for close to half the year.

Looking at the post-WW2 era things improved a bit with the average mid-term year delivering +3.12% per year with a worst drawdown of -5.13%. So, your total return improves but your risk gets worse. Worth noting is that just like the full 1930-2025 period, the post-WW2 era mid-term year also sees close to half the year in a drawdown.

Since Trump is a 2nd term President, we actually have one direct comparable with his mid-term year of 2018. As you can see in the chart below 2018 was all over the place. It went up +9.57% before dropping -20.02% and then ending the year down -6.23%. Most of that year was in positive territory, but the back 70 trading days saw it all fall apart. That 70 days is also where the elections happen to occur.
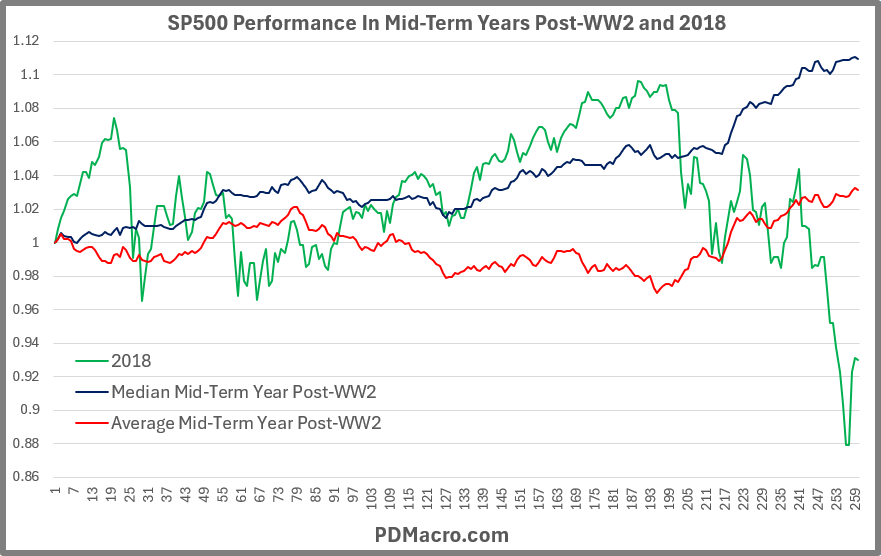
What is interesting is that if you look at the 4-Year election cycle the 3rd and 4th years are usually strong as the incumbents do stimulus to try and juice the economy and help their election odds. At the same time in 17 of the past 19 mid-terms the incumbents have lost the house and lost senate seats as well. It is like the party might care about the Presidential election but doesn’t seem to care too much if the current President is able to do anything the second half of their term.
One more thing worth nothing is that on average after the elections the market tends to do quite well. Once the uncertainty clears, on average at least, it pays to be long.
Happy Trading,
P.S. If you liked this then take a free two week trial of our service. If you have any questions send me an email or find me over at Twitter @DavidTaggart