Seasonality In Economic Expectations: Seasonality Part Two
In our last post we brought up the idea of using seasonality with financial assets apart from just seasonal commodities. The basic idea being that while actual seasons matter for things like agricultural commodities, in financial assets like FX, rates, or stocks the seasonality studies can show other things aside from if it is the rainy season or not.
With seasonality studies you are looking for regularly occurring tendencies, and ideally you are able to figure out why they happen. Like year end tax selling, quarterly rebalancing, end and beginning of the month flows, etc. So when we say seasonality we are not saying that April is special because it is April, but because something might be happening in April that causes it.
CESIUSD-Citi Economic Surprise Index for the US
In this post we will look at the persistent seasonality in economic expectations via the CESI USD Citi Economic Surprise Index.
The CESIUSD shows how good economic data is coming in relative to expectations. It looks at how much data from the past three months is beating or missing median estimates from the Bloomberg surveys. When data is coming in above expectations it goes up, and when the data is coming in below expectations it goes down.
Here is a chart of the data since 2018. As you can see it moves up and down over time. It is very much an economic expectations oscillator.

The Seasonality Pattern In Economic Expectations
Around 2013 or so we were going down the seasonality rabbit hole. We looked at the CESI as part of this and what we found was a fairly consistent pattern. Most years it would start off fairly strong, then about when the 2nd quarter starts it starts to drop. It then remains week until the middle of the summer and then begins to start climbing, only to end the year near the peak for the year.
There is some noise here as some years we have significant events. For instance COVID made the study very messy for a few years but then surprisingly it not only got back into the old rhythm, but it matched right up with the old cycle.
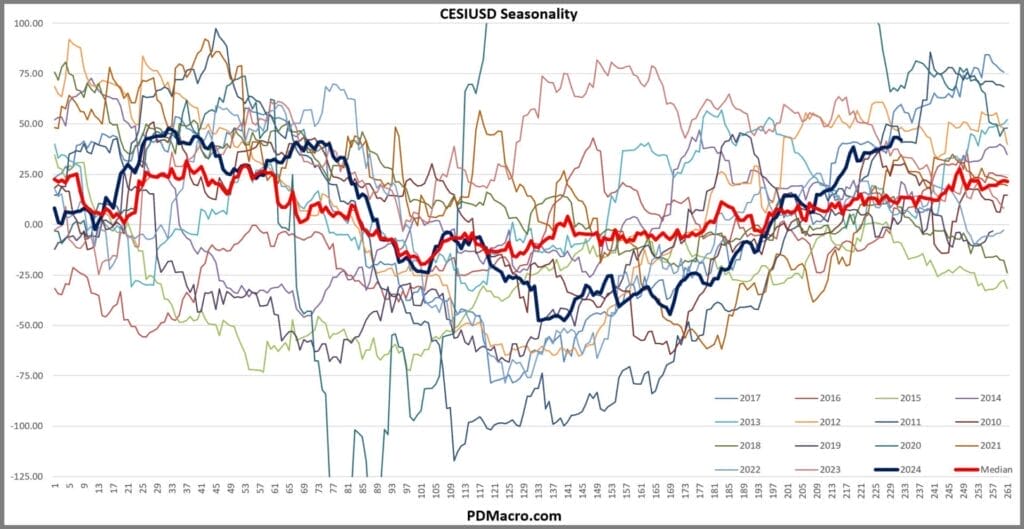
In the chart below we plotted the last 15 years of data by year. We made the median reading the thick red line and plotted 2024 with the thick blue line. We also scaled it to cut off 2020 because the readings were so extreme that it makes the chart unusable.
As you can see most years the data dips into the middle of the year and ramps back up into year end. There is variation but not as much as we would have guessed.

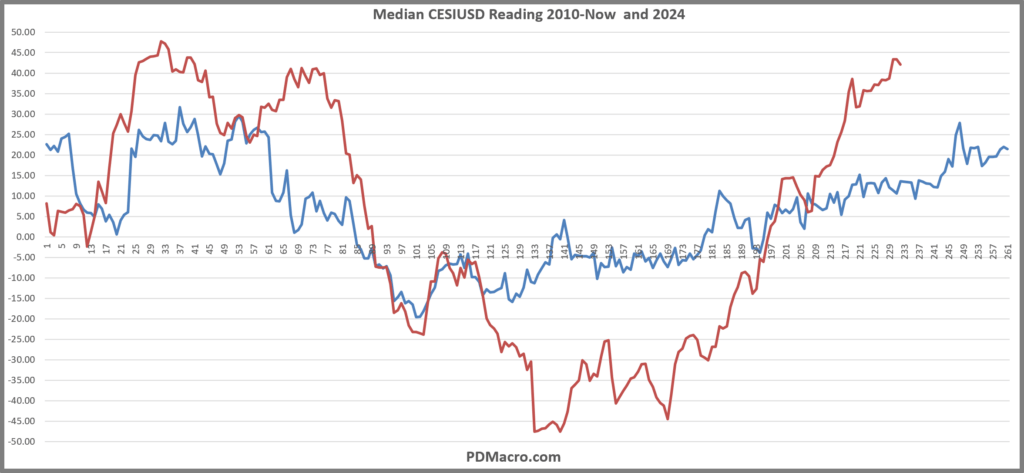
Cleaning that chart up the next chart just has the median reading and then 2024 up until now. You can see that not only does the basic pattern line up, but even a lot of the smaller moves line up. For instance in the first quarter we consistently have two peaks before turning lower.

Why does this pattern happen? One idea is that at the start of the year most sell side strategists are very bullish both to sell product but also because of new government policy programs starting, new year plans for companies, etc. The holiday season and first few months of the new year is the strongest part of the year historically for the stock market, maybe this bullishness finds its way into economic expectations as well. Any of these explanation make some sense to us.
You can use this info when trading stocks, bonds, or currencies. If you take the CESI data and test it across macro asset classes you will find several different strategies that have had an edge over time. If you combine that with knowing when the big turns usually happen you can anticipate and react in a more timely manner.
Current Readings 11/20/24
At the current moment the US CESI has been running pretty hot since the 2nd week of July, but it still has room to run both from a seasonal perspective as well as from the traditional overbought/oversold levels of the oscillator over time. In a few weeks to a few months though it will be set up to turn lower. Anecdotally this matches the current sentiment we see in markets, but it also matches up with how it has reacted historically.
So by the end of January into mid-February we will be looking for data to start disappointing, and by March or April it should be consistently coming in below expectations as the analyst expectation cycle continues.
Happy Trading,
P.S. If you liked this then take a free two week trial of our service. If you have any questions send me an email or find me over at Twitter @DavidTaggart
