The Most Important Chart In The World Part 3 Withheld Taxes
Continuing with out end of year series of The Most Important Charts In the World-You can see part one with the USD and SP500/World ex-US stock ratio here and part two with different US equity valuations here. Today we will look at a series of data from the Daily Treasury Statement.
Withheld Taxes-The Ultimate Coincidental Indicator
Everyday the Treasury puts out a statement showing the daily cash and debt operations of the U.S. Treasury. In this report one of the lines is the Daily Withheld Employment and Income Tax balance.
If people are getting paid more, or if more people are getting paid, or both, then this series heads higher. If people are getting paid less, if less people are getting paid, or both, then the series goes lower. So it shows a daily picture of wages and employment in almost real time. We say almost real time because the data is a bit messy on a day to day basis. Bi-weekly pay periods, end of month, end of quarter, etc. will do that.
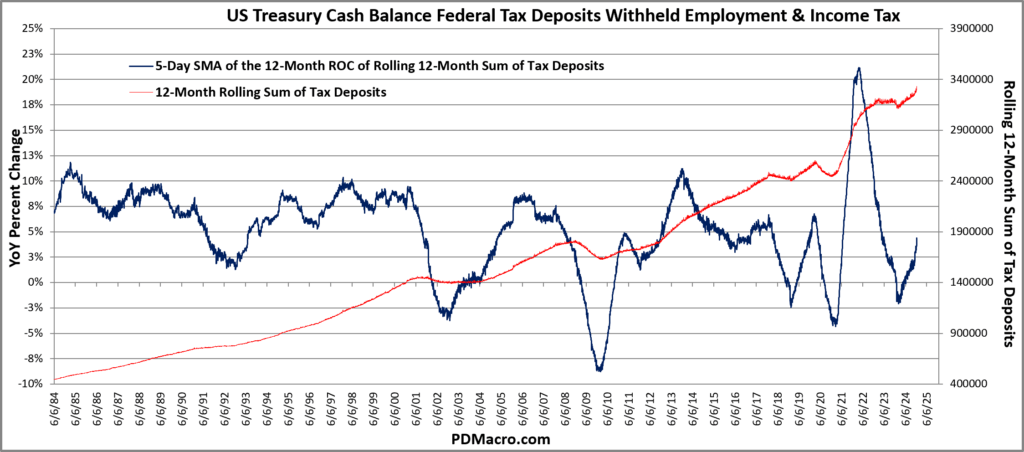
If we look at this data on a year over year basis we have a great indicator showing earnings across a broad swath of the economy. In this chart we have the year over year data in blue, and then the 12-Month Rolling Sum in red.

As you can see it takes a strong recession for tax deposit growth to drop negative on a year over year basis. You need both higher unemployment and lower wages to take this one negative. Even in the bad times most people are taking home a pay check. Since 1983 we have only had three “normal” times where the year over year data went negative. We also had COVID and the post-COVID move where it went negative, wildly positive, and then negative again as the data normalized at the same time we had a bit of a slowdown.
What you will also notice is that we bottomed in February of 2024 and have been ramping higher ever since, crossing the 0% line in April 2024. Right now it is above 4%. In our view this indicates a fairly healthy employment and wage situation, which is another way of saying a fairly strong consumer.
So why do we think this is one of The Most Important Charts In The World right now? Well it is at 4% and usually doesn’t peak until the 8-11% area. Once it peaks it rarely just turns around and goes back down. Usually it oscillates for months and years above the 0% line. Go check out the SP500 year over year and see for yourself if that tracks.
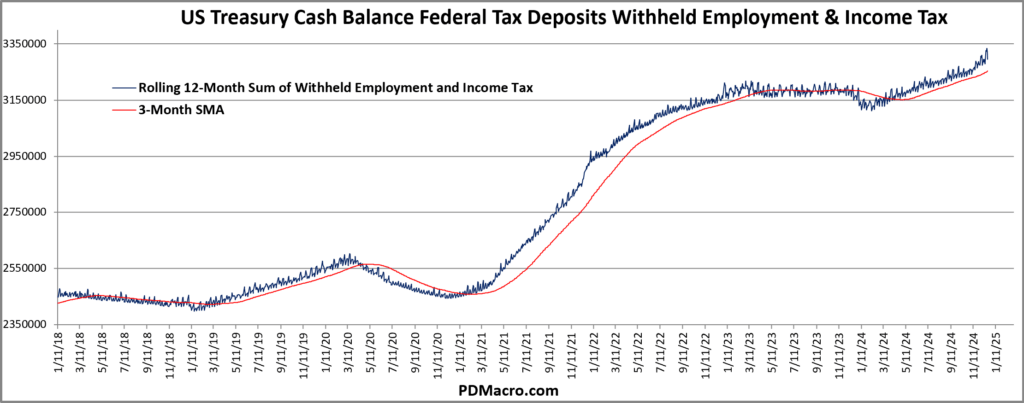
We thought it was worthwhile to also show the rolling 12-Month sum in it’s own chart so you can see how it has acted the last few years. You can see the 2020 move lower, the giant move higher, and then the effects wearing off all of 2023 at the same time that we were seeing weakness in employment particularly in the tech sector. But you also can see how it ramped higher for almost all of 2024.

What Next?
Anything can happen, but it is not only rare, but outside of the the pandemic we have never seen the withheld taxes run up and then tank. So if the last 40 years are any guide we can likely expect wages and employment to be decent, if not perfect, moving forward for a while.
Yes, we have a new President coming in and depending on your political death cult you might think that this is the best or the worst thing ever, but based on history it is probably neither. Under the last seven Presidents we have not had one huge downturn where you can lay all the blame on one party let alone one President.
Looking at the data it is clear that we are blessed to have an economic juggernaut that usually just plows forward regardless of all the noise. This is a feature and not a bug.
Anyways we expect withheld Federal taxes to stay strong for some time moving forward. You can choose for yourself what this means regarding your positioning.
Happy Trading,
P.S. If you liked this then take a free two week trial of our service. If you have any questions send me an email or find me over at Twitter @DavidTaggart
