
The 10 And 20 Best And Worst Days In And Out Of The Market
In our last piece we shared some thoughts on market timing, and how we disagree with the way a lot of people look at the endeavor. In it we referenced this piece by Meb Faber at Cambria showing the other side of the “if you missed the 10 best days in the market” line thrown about by wealth managers that get paid an AUM fee. And not to say that you should be flipping positions all day but if you see a good opportunity aka a “fat pitch” then you should swing, and if you are not looking then you won’t see it or swing at it.
So with that let’s dig a bit into the “if you missed the 10 best days” and “it is time in the market, not timing the market” lines.
The SP500 Returns
We used price only data, so none of this includes dividends. Since we are only pulling out 10, 20, and 40 days in total over the entire period the effect will be almost the same, even if the ending totals are drastically different. In case you are not familiar price data does include dividends, and over almost 100 years the dividends add a LOT to total returns. But for this exercise we are using price only. It still shows the point we are trying to make.
First let’s look at the SP500 and the associated drawdowns over time. This visual seems to help people see the periodic downside risks that come along with buy and hold. The first chart is the price only index and the all time highs line.
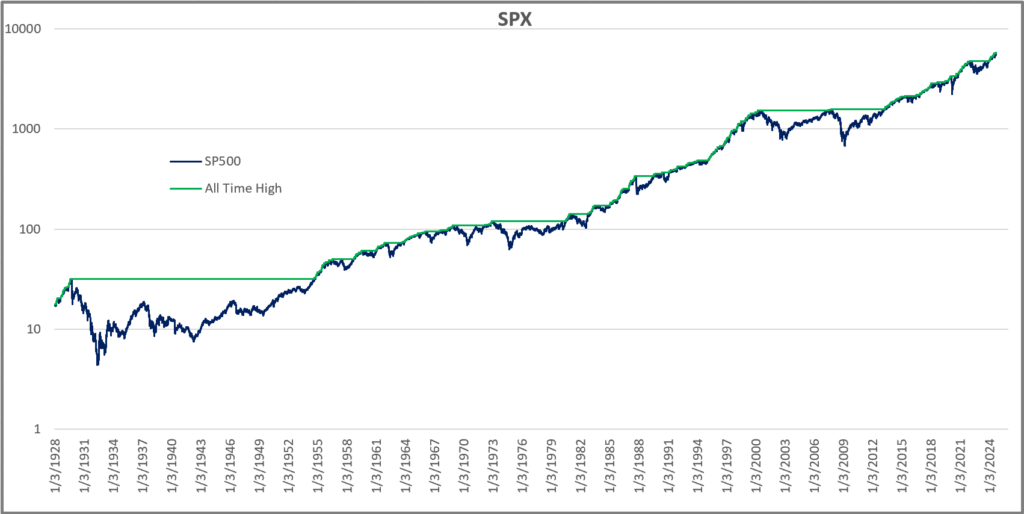
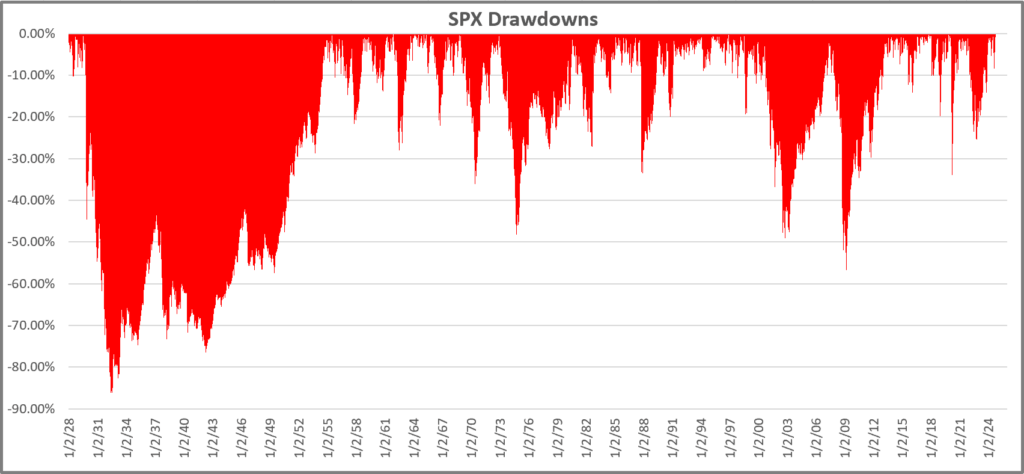
next up we have the drawdown chart. Anytime the index is not at its highs, it is in a drawdown. Most are not that big a deal, but some are huge deals. And these are nominal and not inflation adjusted, which only get worse.
So if you invested $100 in 1928 then you end up with $32,325.88. Here is the chart showing Buy and Hold.

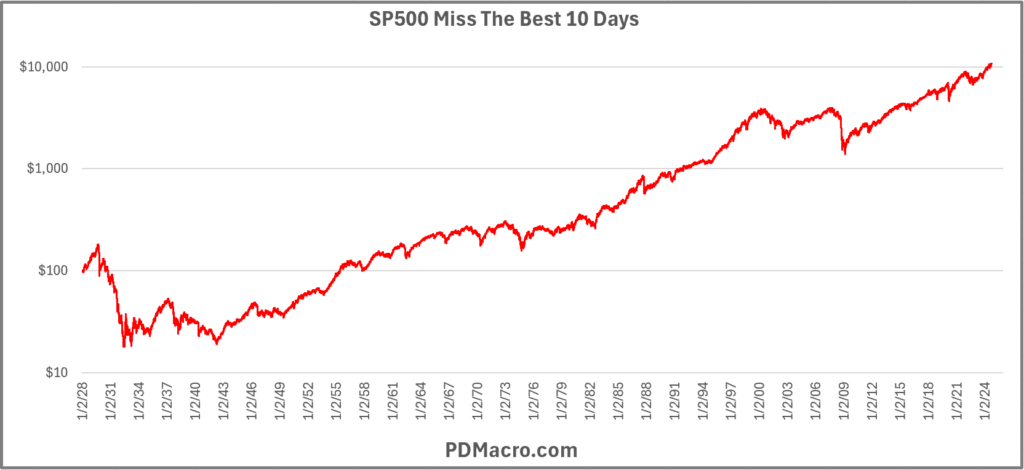
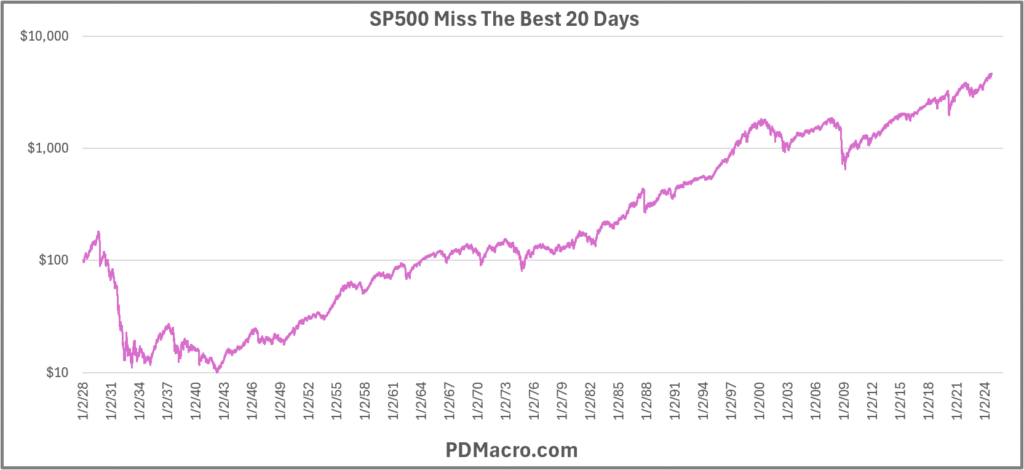
Missing The 10 And 20 Best Days
If you miss the best 10 days from this period your $100 turns into $10,710.94
If you miss the best 20 days from this period your $100 turns into $4,596.70
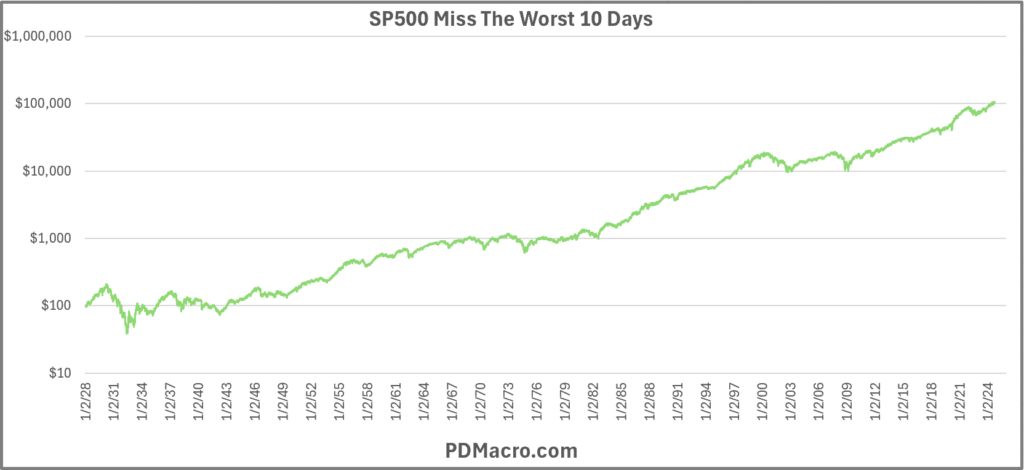
Missing The 10 And 20 Worst Days
If you miss the worst 10 days from this period your $100 turns into $105,808.38
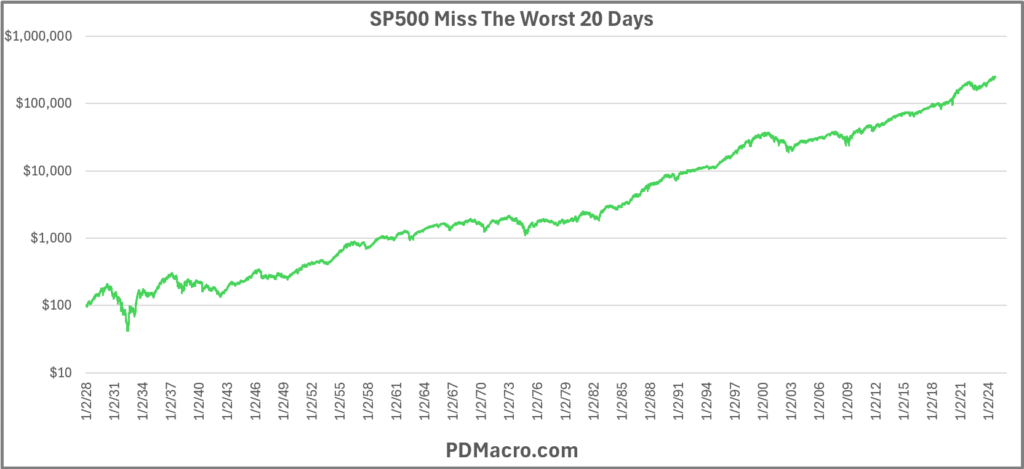
If you miss the worst 20 days from this period your $100 turns into $250,315.43
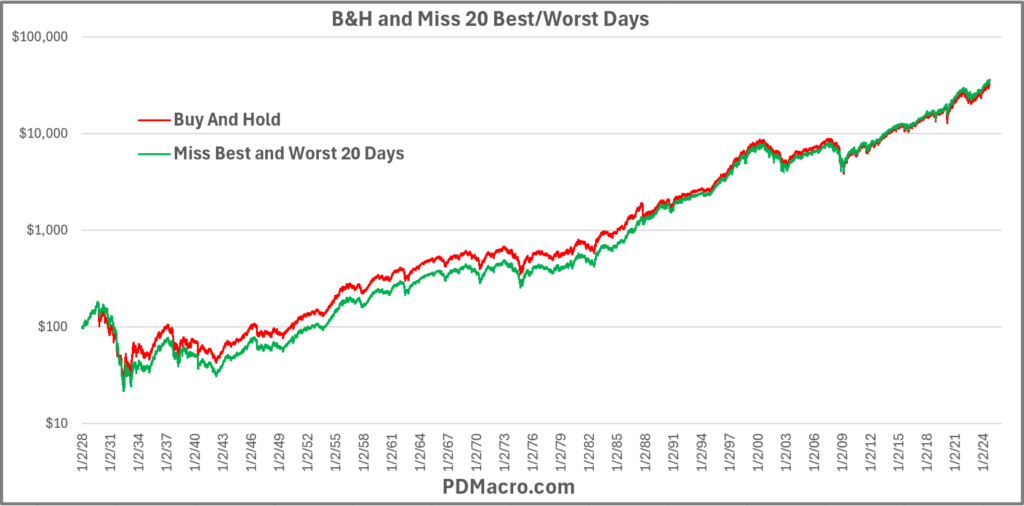
Missing Both The Best AND Worst Days
If you miss the worst 20 best AND worst days from this period your $100 turns into $35,594.53. But in this chart we also put in the Buy and Hold line as well. Turns out that in the end it is only a $3k difference between the two. Missing the 20 most volatile days barely edged out buy and hold, but it shows that as long as you miss some of the bad days, missing some of the best days is not the end of the world.
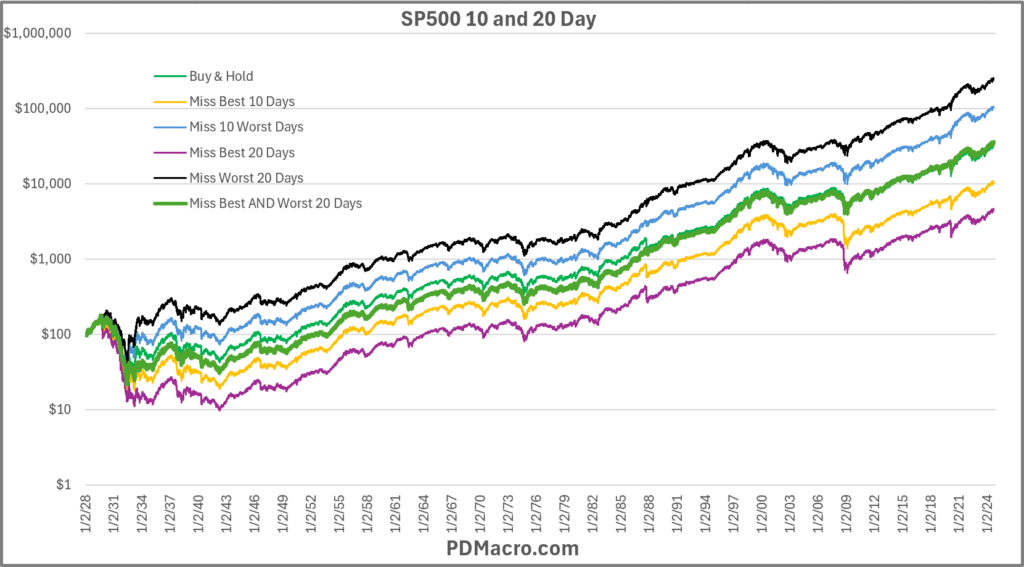
The Big Chart
Here are all six return streams. As these are all logarithmic scaled charts they might not look wildly different, but if you look at the numbers you can see that they really are. From $4,596.70 to $250,315.43 in ending amounts the 10, 20, and 40 most volatile days can definitely affect returns.
And here is a table showing the different ending amounts depending on how many days you missed and if the days were the best or worst days.

Where Do Most Of These Days Hide?
As you can see in this table 65% of the “best 20 days” and 85% of the “worst 20 days” happen when the index is below its 200-Day moving average. And while they are lumped into two general cycles, the great depression and the 2008 global financial crisis, we still see how in the worst markets of the last 100 years the principle holds up. That most of the up and downside volatility, aka the volatility gremlins, hide in downtrends.

The Takeaway
The main takeaway from this is that market change over time but human emotions do not. Fear and greed make us act in very similar ways over the decades and centuries. That a LOT of the sayings out there come from the marketing department, and not from a fair treatment of the data.
Another thing that you hopefully already know, but we will repeat it, is that at least when it comes to stocks over time you DO want to be long far more often than not. But there is a lot more you can do to make the ride a bit more palatable over time as well, even if some of the sayings are a bit misleading.
What Else?
There are a LOT of things we did not look at here. Things like going to bonds when stocks are in downtrends, just earning interest on the case while in downtrends, how to take advantage of extreme readings with tactical trades, etc. This was simply what happens with missing the best and worst 10 and 20 days over the past 97 years. There are a million paths you can go down with these simple principles.
Happy Trading,
P.S. If you liked this then take a free two week trial of our service. If you have any questions send me an email or find me over at Twitter @DavidTaggart