
Market Sentiment 101.1
“The time to buy is when there’s blood in the streets.”-Nathan Rothschild…maybe
Nathan Rothschild is credited with saying that quote, but no one seems to know if he actually said it. Regardless of if he said it or not, the idea rings true. Buy things when no one wants them, and sell them, when everyone wants them. Presumably, the trough is when the last seller has sold, and the peak is when the last buyer has bought.
Maybe the first recorded contrarian trade was done by the Prophet Joseph in Egypt (I mean, is it blasphemy to call him Joseph the hedge fund manager?).
In Genesis chapter 41 we read that the Pharaoh had a dream and no one was able to interpret it. He heard that Joseph was able to and called for him. Joseph came and interpreted the dream. In verses 29-30 he said:
29: Behold, there come seven years of great plenty throughout all the land of Egypt:
30: And there shall arise after them, seven years of famine; and all the plenty shall be forgotten in the land of Egypt; and the famine shall consume the land;
As you likely heard growing up in Sunday School Joseph then was entrusted to save, and store grain for the seven years of plenty, only to save Egypt the next seven years during the great famine. There is a lot more to the story of Joseph, but not, so much more about contrarian trading.
So, Joseph the Prophet, and managed futures fund manager saved a kingdom from starvation by buying when everyone was happy to sell, and to sell when everyone was desperate to buy. He had divine inspiration, we don’t, well maybe Jim Simons does, but the rest of us don’t. So, what do we do?
We use tools. You can pray, but I have a theory on that, 99.99% of the time I don’t think God cares if you make or lose money slinging spoos. Just a guess.
The Toolbox
Over the last 22ish years I have tried in vain to classify the different sentiment indicators. I say in vain because while you can make a fairly exhaustive list, too many of the indicators overlap with each other. Still, the basic classes enable you to get good short, medium, and long-term measures of how bearish, and bullish the crowd is.
So, with that caveat here are the categories, or maybe better is “here are some categories.”
Positioning-
Things like the commitment of traders reports, options data, ICI fund flow’s, 13f’s, ETF holdings, etc. The CFTC report, and options data is the most timely, with the CFTC report coming out each week, and options data being available in real time.

Market Data-
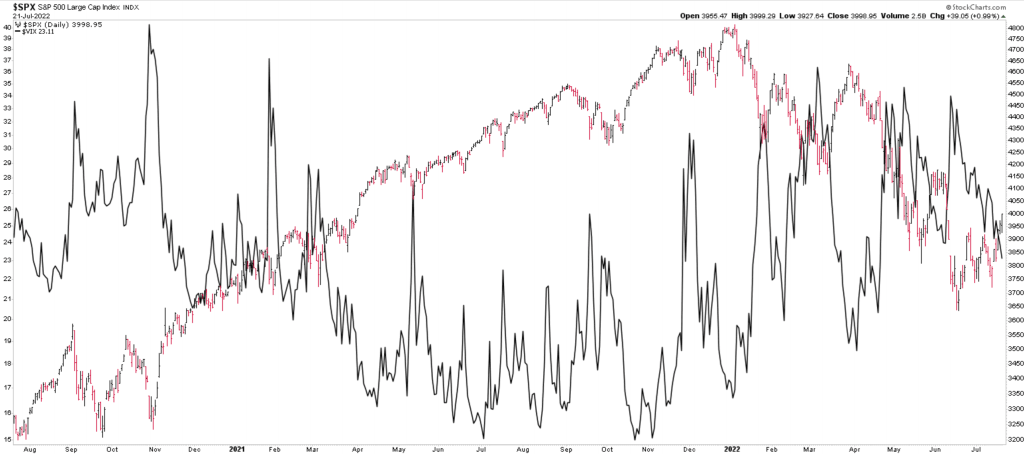
Some of these are just derivations from positioning type data, but is different-ish? Either way, most of them, are available on a real-time or daily basis. Things like the VIX, P/C ratios, GEX, DIX (thank you Squeeze), CEF, and ETF premiums/discounts, and even money flow indicators like OBV of Joe Granville fame, and Money Flow from Lazlo Birinyi. All of these are measuring, or attempting to measure where money is going, and how it fits in the fear, and greed cycle.
Valuation-
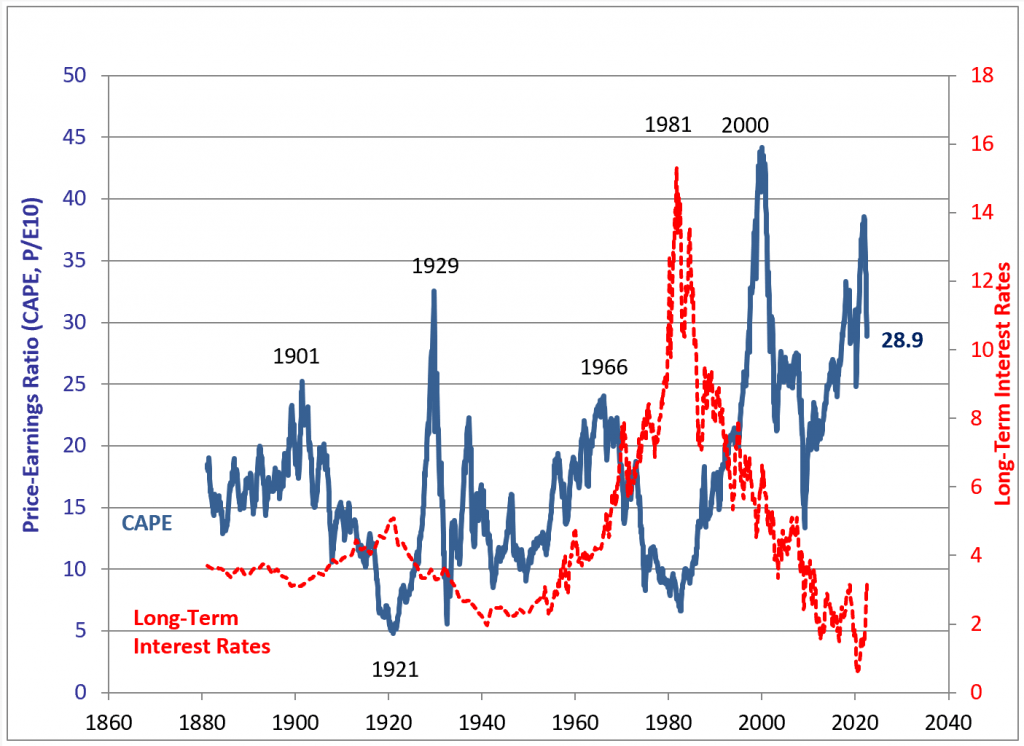
Yeah valuation is a sentiment indicator, it is even a flows indicator, but for whatever reason it is different. More often than not, it is also a long-term indicator. If you try short-term trading based off of P/E ratios, you are likely to get chopped up. But all valuations represent are how much investors are willing to pay for the future prospects of the company or other assets. Some say the future cashflows, but we like “prospects” more as some assets trend for years with zero expectations of cash flow’s.
Indicators-
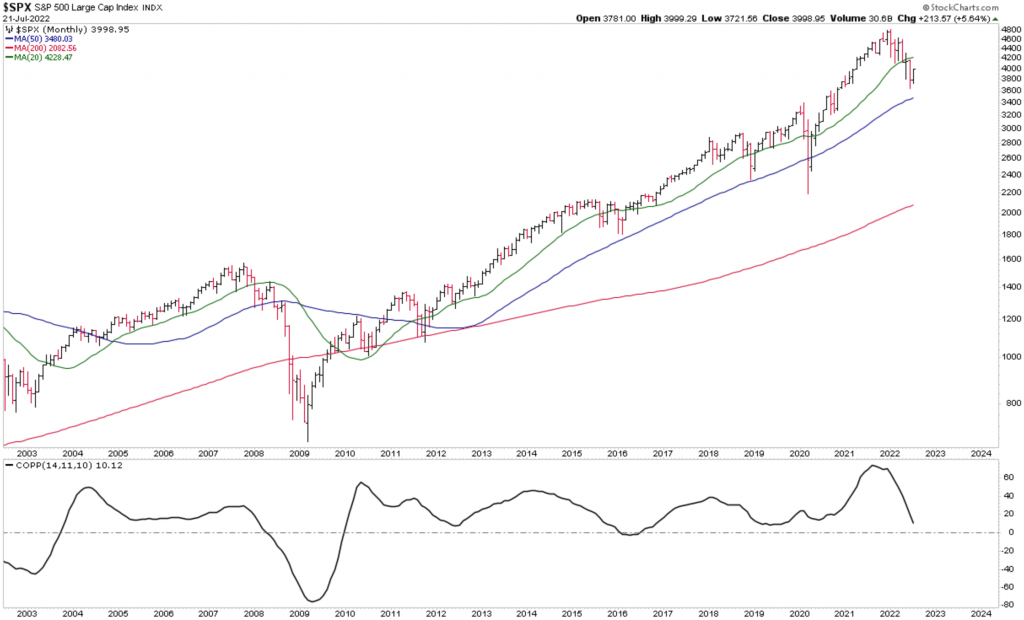
All of these are indicators, but here I am talking about mostly price derived indicators. Things like the Coppock Curve, RSI, and other overbought/oversold indicators, Tom DeMark indicators attempting to pick exhaustion points, trending indicators like moving averages or Donchian channels, etc. Literally anything that is attempting to measure price action is attempting to measure what market participants are doing in a way, that could be useful to determine the prospects looking forward.
Survey Data-
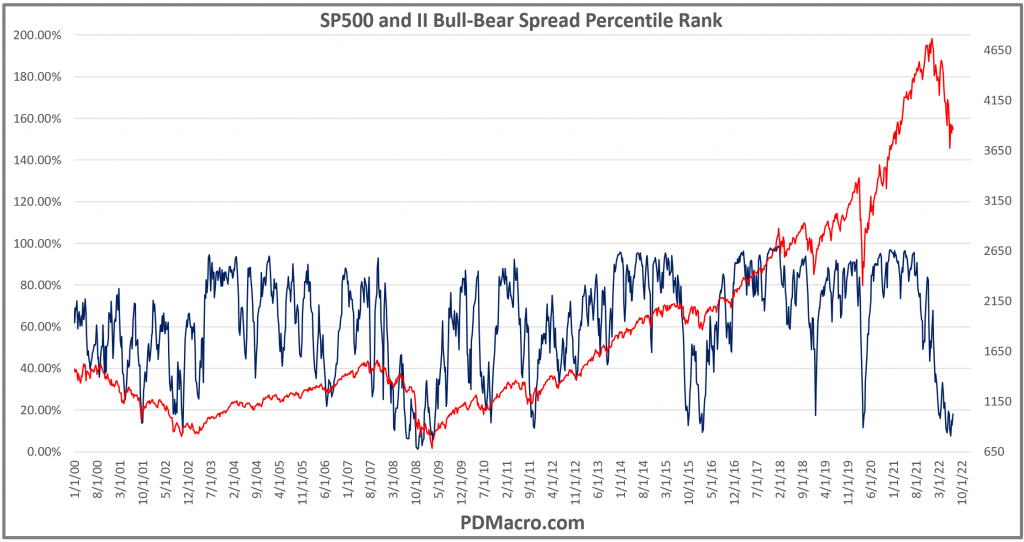
I am not sure when the first market survey was taken, but I have II-Investors Intelligence data going back to 2/1/1963. So, since at least 1963 Chartcraft has been maintaining that dataset. II has the percent of people who are bullish, bearish, and neutral on the stock market. Since then, II has continued, and then we got AAII, MarketVane, Consensus, and others. About three months ago the PDMacro Financial Markets Survey started as well.
Other surveys that can be used to measure things are consumer confidence, Gallup, and Pew data, and even the Survey of Professional Forecasters.
Alternative Data-
Alt-Data, maybe the most used, and abused term in finance the last few years can include a lot of things that don’t fit neatly enough into any of the above categories. But the space is expanding rapidly. Tools like the Google Cloud Natural Language, Cohere NLP, Deep Talk ml models, etc. can fit here. They are using different machine learning, and natural language processing models to measure sentiment in anything from market data, to tweets, to earnings calls, Amazon product reviews, and GlassDoor reviews.
This space is growing very fast, but at an almost equally rapid rate it is becoming accessible to anyone technical enough to use a CSV file. Five years ago you had to know how to code, today you can scrape, and upload without a high skill level.

Narrative Data-
You can make the case that all of the above fit under this category, but we are talking about things that are not, traditionally measurable. Things like the classic magazine cover indicator originated by the late, and great Paul Macrae Montgomery. The modern-day version of this could be the website front page indicator.
You can pay attention to how the man in the street feels, or how the newscasters are acting, etc. The list for “narrative data” can go on forever, but can maybe be summed up by “traditionally unquantifiable indicators” but of course everything is quantifiable to a point. Montgomery was able to measure his stack of Time magazine covers, and these days you can process the language, and even the images of covers or newscasts, and get a number or rating to measure this sentiment.

Composites-
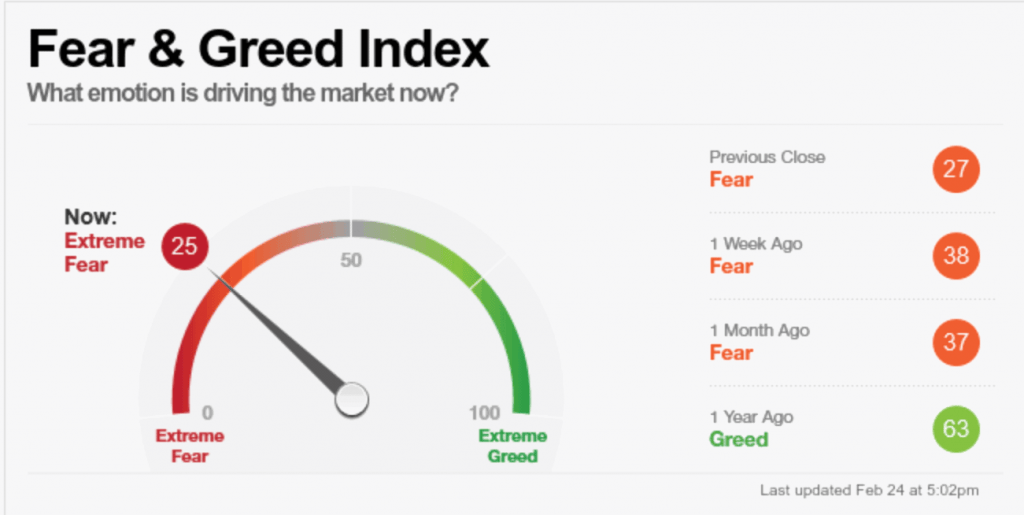
Do we need to say it? The CNN Fear, and Greed indicator is the most shared link, and chart on FinTwit when it is above 85, and below 15. The rest of the time people might mention it, but no one cares because it is not, at an extreme.
The CNN F&G model is far from the only composite indicator, but it is the easiest to access, and is very well known. It is made up of seven different indicators that measure different parts of the market to see if investors are overly bullish, overly bearish, or mostly neutral.
You may have noticed that the title of this piece says 101.1. That is because 101 would be a bagillion pages long, and no one wants to read that. So, for 101.1 we discussed the general classifications of sentiment indicators. In future segments, we will discuss each group, and where, and how one can use them.