The SP500 From Election Day To Year End
What Happens To The Stock Market When Your Candidate Wins The Election?
We have a presidential election every four years. Sometimes the incumbent wins, sometimes they lose. But so far, at least as far back as we have decent stock market data, someone from one of the two dominant parties wins.
Everyone wants to think that their party is the best for the economy and the stock market, but if you have read any of these pieces before the reality is that it is a lot messier than just “our party is the best.” And since over time both parties have shifted…a LOT, this makes sense. Also on a day to day basis the President doesn’t really have much power to move the economy to their will. People seem to think they have a special econ knob they can turn to make things better or worse, but alas it is not that easy.
In this post we want to look at what has happened since WW2 (1944) to the SP500 from election day into the end of the year.
The SP500 From Election Day To The End Of The Year
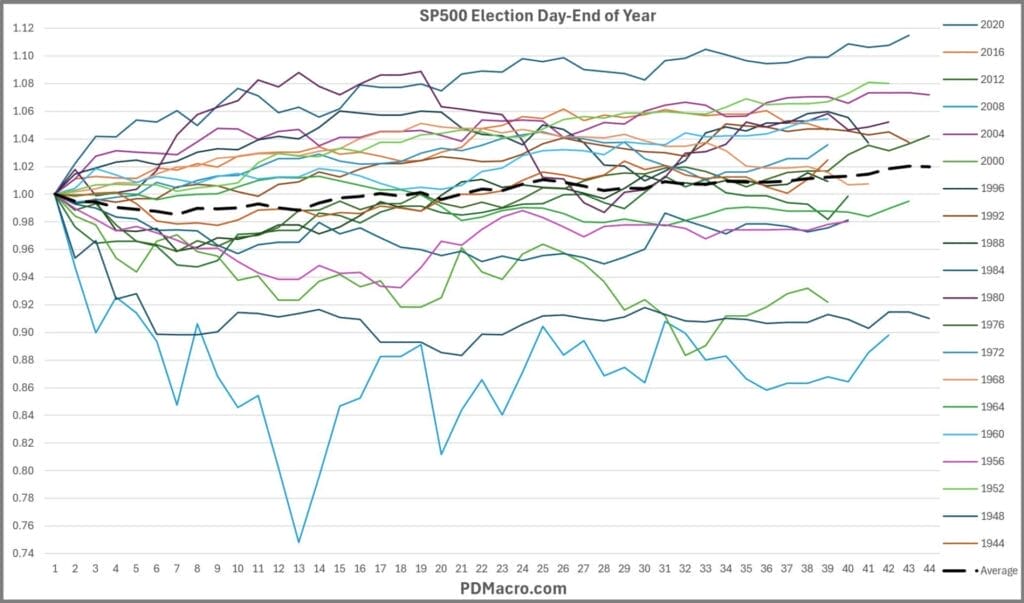
Here is a chart of the SP500 from election day-day 0-to the end of the year. All years had at least 38 trading days, and some had up to 43 trading days. In this chat we show all of the years and the average of all the years.

If you look at the bottom three election years you will see something. 2000 and 2008 both were during bear markets from the last Presidents term…and they were not great years. The other of the three was 1948 when Truman won. Love or hate him, the market had been in a range for two years at that point, and took another two years to break out, so did the market go down because he won, or because it went down?
The SP500 From Election Day To The End Of The Year When Republicans Win
In this next chart we have each year the Republicans won the election. The best year was 1952 when Eisenhower won and the worst year was 2000 when Bush 2 won. Bush 2 had the 2nd best year though when he won in 2004, and Eisenhower had the 2nd worst year when he won in 1956.

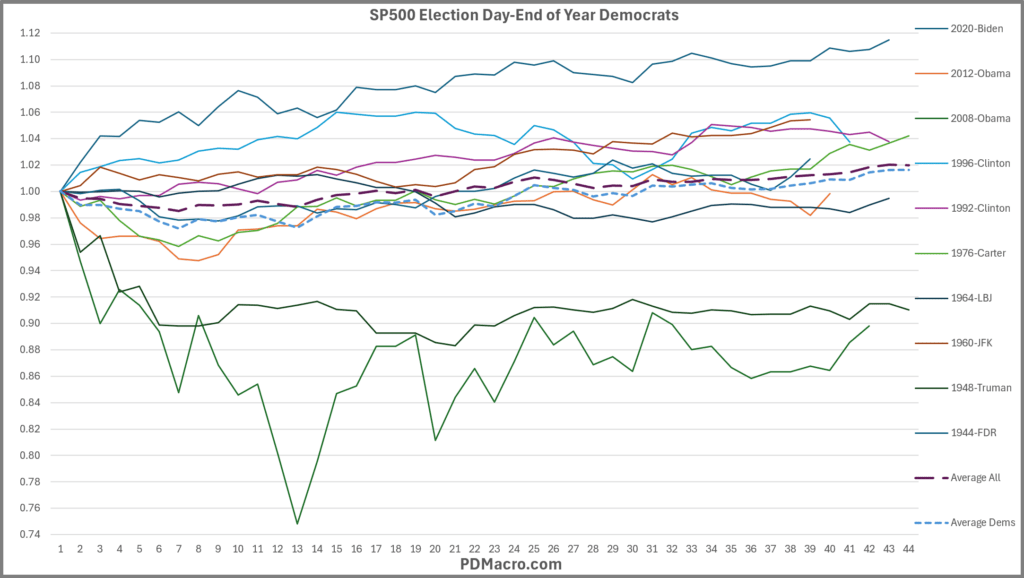
The SP500 From Election Day To The End Of The Year When Democrats Win
If we look at the Democrats the best year was 2020 when Biden won. We were coming out of COVID with record stimulus and the vaccine was announced December 11th of 2020. The worst year on the other hand was 2008 when Obama won. So Democrats had both the best and the worst year of this study.

So Who Wins?
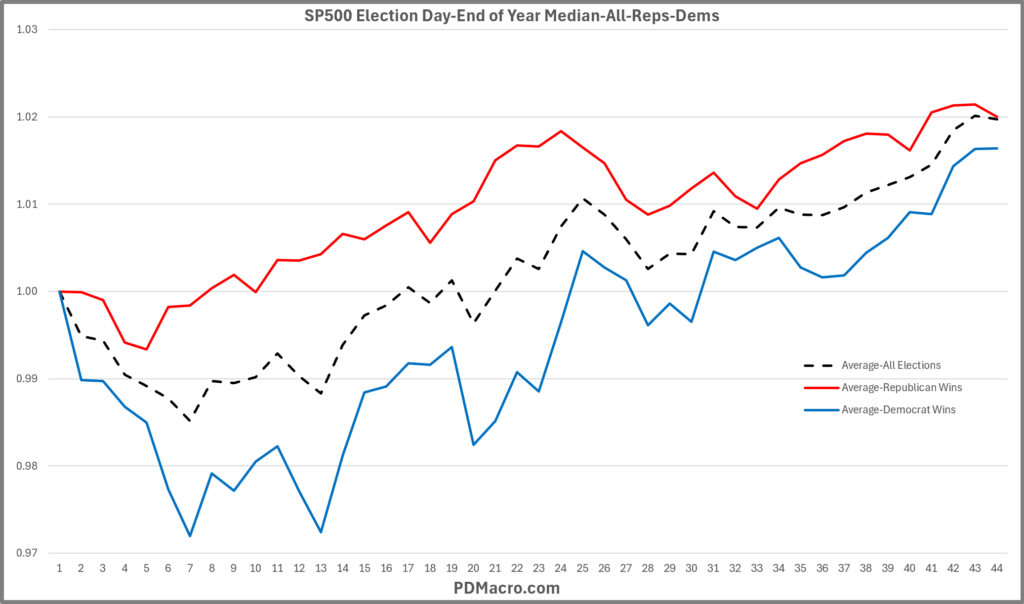
By a slight amount the market has done better into year end when a Republican has won the election since 1944. But as you might have noticed the two are quite correlated, and in the end both end up with positive markets by year end on average.

One thing to note is that after day 38 the last five trading days see an uneven drop-off, so the averages are a bit goofy from that point on. It doesn’t effect the overall results too much, but it does effect them.
What Now?
It would be worthwhile to look at the trend coming into the election to see how things are likely to go. If you had historical poll data you could also determine if the election result was a surprise or not. You could also look at policy proposals at the time, run sentiment analysis on them, and then see how the market does. Really there are countless things you can do, but we are not sure it is worth the effort.
This is seasonally the best time of the year for the market, most years end up positive, and regardless of who wins, the Presidential Cycle is in effect coming into elections. So if the trend is up and we are in an economic expansion the data would suggest that you want to be long equities into and after Presidential elections headed into year end.
Despite how it feels sometimes the US economy has been a juggernaut for a long time now and all of these people think they are doing what is best for the country. So on average while not perfect, things actually go pretty well. So go ahead and read and invest based on policy-Trumps Tax Bill and Bidens CHIPS Act are both great examples-but don’t expect 1987 or 1929 to happen just because Trump or Harris wins. It could happen, but then Martians could land on the White House lawn as well, so there’s that.
Happy Trading,
P.S. If you liked this then take a free two week trial of our service. If you have any questions send me an email or find me over at Twitter @DavidTaggart
